Figures & data
Figure 1. Cloud service models and corresponding examples.
Figure 2. Architecture diagram of ModflowOnAzure.
Figure 3. Map of the interconnected ETPV aquifers (the groundwater wells are in circles).
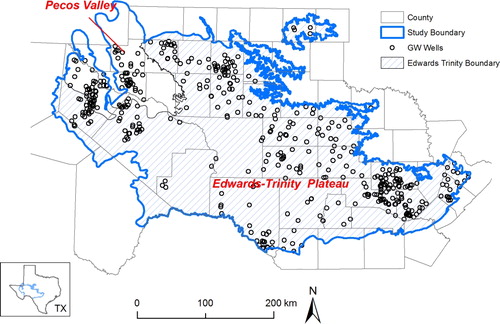
Figure 4. Arizona case study site (Santa Cruz active management area).
Figure 5. Distribution of simulated heads near Tubac, Arizona.
Figure 6. Computational performance of ModflowOnAzure for the global sensitivity analysis case study.
Figure 7. An example of the global sensitivity analysis results obtained for the ETPV model. Shown here is the contribution of the first-layer hydraulic conductivity values to the RMSE measure in terms of (a) the first-order Sobol' index and (b) the total Sobol' index. The first-layer hydraulic conductivity zonation consists of five zones (c). The elevation of the top of model (d) is also shown.
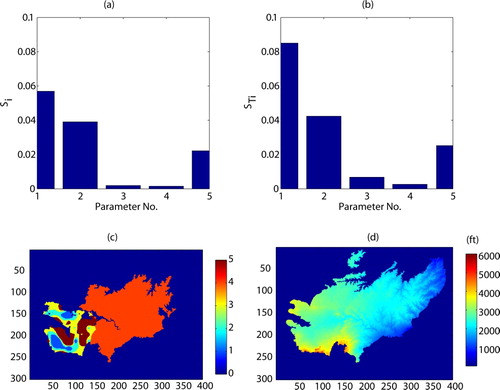
Figure 8. Number of Years with Simulated Net Groundwater Discharge Between NIWTP (Rio Rico) and Tubac as a Function of Pumpage (from 11K to 23K AF/YR): 100×6 ACM Ensemble.
Figure 9. Simulated Groundwater Hydraulic Heads at Tumacacori: Base Model (shown) Realization #2 (‘dry’); Years 1–90 Infrequent Flood Recharge; Years 91–100 Frequent Flood Recharge.