Figures & data
Figure 1. Yearly frequency of reported dust storm events, fatalities, injuries, and property damages in Arizona from 1995 to 2010 (the unit of property damages is k dollar) (Data source: NOAA).
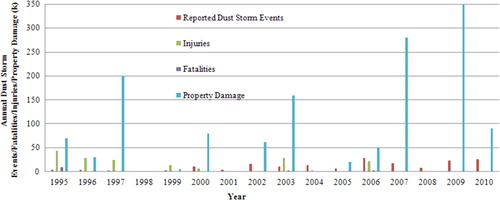
Figure 2. Reported yearly frequency and percentage of the total time of dust storm events in the United States (Data source: NOAA).
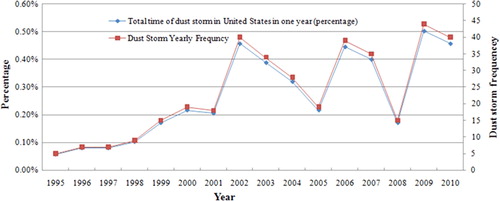
Figure 3. The computing time and required CPU numbers for different resolution forecasting (adopted from Yang, Wu, et al., Citation2011).
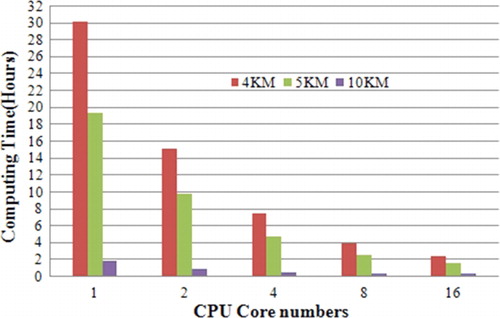
Figure 4. Nested modeling approaches.
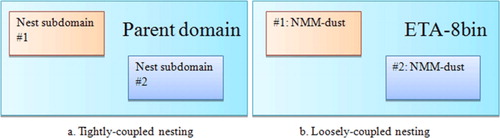
Figure 5. The process for deploying dust storm models onto Amazon EC2 (revised from Huang et al., Citation2010)
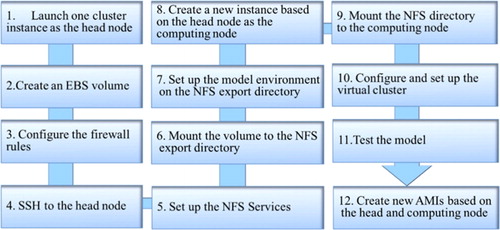
Table 1. The configuration of EC2 and our HPC cluster computing platform.
Table 2. Average time spent on deploying dust storm model on Amazon EC2 and local time.
Figure 6. Computing time and difference for 3 KM resolution, 4.8×4.8 degree domain size, and 3-hour forecasting with 1, 4, and 8 Amazon EC2 and our HPC computing nodes with different process numbers.
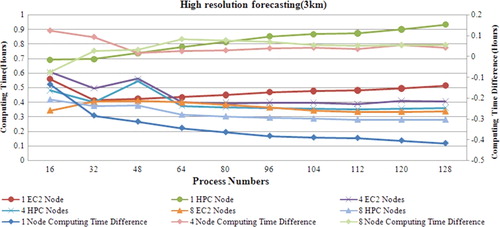
Figure 7. NMM-dust execution time for 15 forecasting tasks on Amazon EC2 and HPC cluster.
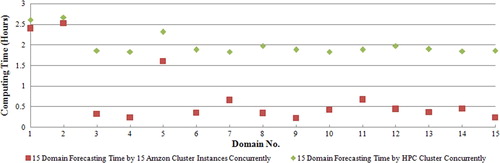
Figure 8. Pictures of a haboob that hit Phoenix, Arizona, on 5 July 2011 (courtesy of Meteorology News Citation2011).
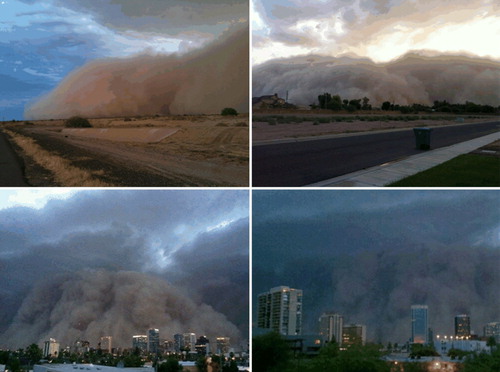
Figure 9. AOIs distribution identified by the ETA-8bin on 5 July 2011.
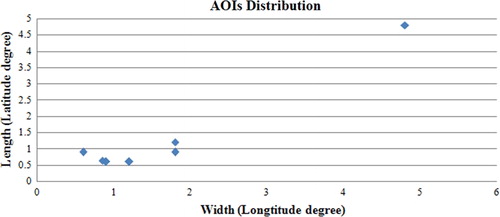
Figure 10. Seven Amazon cluster instances are launched to run seven AOIs in parallel with each instance simulating one AOI region for 24-hour forecasting.
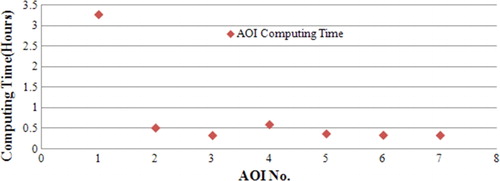
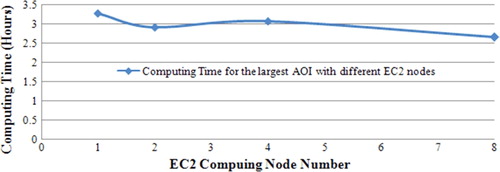
Figure 11. Computing times for the largest AOI with different computing nodes for 24-hour forecasting.