Figures & data
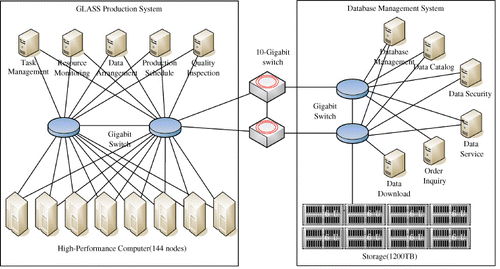
Table 1. Specifics of the hardware devices within the GLASS product production system.
![Figure 2. Three examples of the improved MODIS surface reflectance images using the TSCD algorithm (left) compared to the original MOD09A1 (right): (a) Amazon, (b) Java, Indonesia, (c) Bohai area of eastern Asia. All images were acquired on 28 July 2001.](/cms/asset/16ef647c-57f2-4fb1-8b78-fb7607701494/tjde_a_805262_f0002_oc.jpg)
![Figure 3. Original AVHRR data from the NASA 0.05° long-term AVHRR data-set on 7 January 2000 (top) and the reprocessed data (bottom). Color composite using bands 1 (blue), 2 (green), and 1 (red).](/cms/asset/99361030-af7a-488c-ac19-331e27130e9e/tjde_a_805262_f0003_oc.jpg)
Table 2. Characteristics of the five GLASS products.
Table 3. Summary of the current global shortwave broadband albedo products.
![Figure 4. GLASS albedo product at five sites: (a) Fort_Pack, 48.3079N, −105.101E, glassland; (b) ARM_SGP_Main, 36.605N, −97.4884E, cropland; (c) Duke_forest_hardwoods, 35.9736E, −79.1004N, mixed forest; (d) Naiman_site, 42.9333E, 120.700N, desert; (e) NASA-SE, 66.4797E, −42.5002N, ice sheet.](/cms/asset/cb0cf554-5890-4d75-99d5-0be8bb3972e6/tjde_a_805262_f0004_oc.jpg)
![Figure 7. Global land surface monthly integrated incident PAR in 2008 at 5 km spatial resolution calculated from GLASS PAR product in (a) January, (b) April, (c) July, and (d) October.](/cms/asset/d9012599-7f9d-4e5c-85d7-4e5963dd9b6b/tjde_a_805262_f0007_oc.jpg)
Table 4. WMO observation requirements for surface downward shortwave irradiance by Space program. NWP: Numerical Weather Prediction, AOPC: Atmospheric Observation Panel for Climate. (http://www.wmo-sat.info/db/variables/view/50, updated on 23 June 2011).
Table 5. Summary of the current global incident shortwave radiation satellite products.
Table 6. Comparison of retrieved 3 h GLASS insolation product, the International Satellite Cloud Climatology Project—Flux Data (ISCCP-FD), CERES model B, and the CALISPO, CERES, Cloudsat and MODIS (CCCM) enhanced product in 2008.
Table 7. Summary of the current global spectral emissivity products. IASI: Infrared Atmospheric Sounder Interferometer.
![Figure 8. Long-term global surface thermal broadband emissivity mean values for five land cover types from the GLASS emissivity product. The UW-Madison CIMSS emissivity product (narrowband emissivity values are converted into the broadband emissivity using the published formula, Cheng et al. Citation2012) is also presented for comparison. Land cover maps are from the MODIS product: Majority_Land_Cover_Type_1 (MCD12C1 V5) and the land cover map from 2000 is used for the mean value calculation before 2000.](/cms/asset/fadecacf-1f8e-45aa-a2ea-c428b126a31d/tjde_a_805262_f0008_oc.jpg)
Table 8. WMO observation requirements for LAI by Space program. (http://www.wmo-sat.info/db/variables/view/98, updated on 3 June 2012).
Table 9. Summary of the current global LAI products; current products do not meet the user requirements.LAI products
![Figure 11. Temporal variations of global average LAI from 1981 to 2012 (y-axis has been multiplied by 10).](/cms/asset/a1d4adbd-240e-4b0a-a1ae-5d394bd45e48/tjde_a_805262_f0011_oc.jpg)