388
Views
16
CrossRef citations to date
0
Altmetric
Original Articles

Preliminary validation of GLASS-DSSR products using surface measurements collected in arid and semi-arid regions of China

, , , , , , & show all
Pages 50-68 | Received 17 Sep 2012, Accepted 11 Jul 2013, Published online: 10 Sep 2013

Figures & data

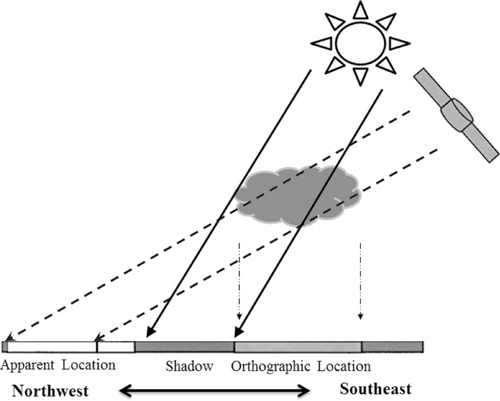
Figure 1. Schematic diagram explaining why the spatial collocation effect happens when MTSAT images are used to retrieve surface solar irradiance over China (the surface is considered the referenced plane).

Table 1. Basic summary of the meteorological sites used to validate GLASS-DSSR products.
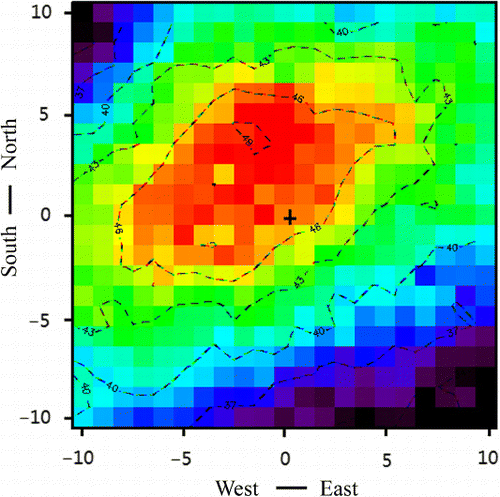
Figure 2. Spatial collocation effect at the Daxing site. Contour/intensity map of explained variance (in%) between the atmospheric transmittance series derived by surface observed irradiance and the corresponding MTSAT VIS TOA reflectance series from June to October 2009. The black cross denotes the location of the Daxing site and also the origin of the coordinates.
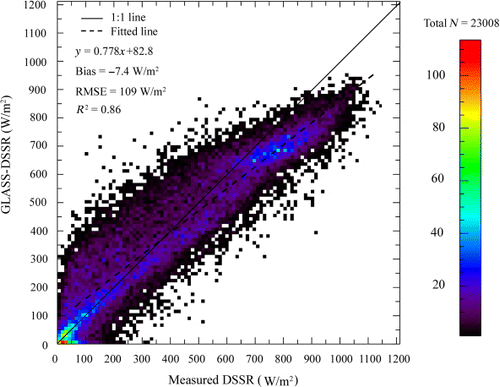
Figure 3. Comparison of the GLASS-DSSR products and 12 sites’ measurements from ASRCOP data with the validating scheme described in this paper. Color represents the number in each unit bin that the (DSSRMeasured, DSSRGLASS) pair falls into (10 W/m2 increment).
Figure 4. Performance of GLASS-DSSR products at six sites in temperate continental climate.

Table 2. Statistics of the comparison between GLASS DSSR and observed DSSR at individual site during summer of 2008 and/or 2009.
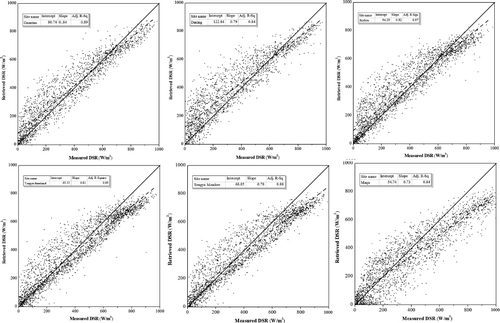
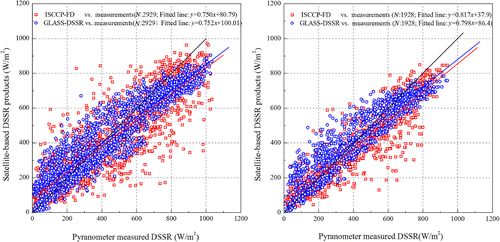
Figure 5. Performance of GLASS-DSSR products at five sites in temperate monsoon climate (from upper left, first five), and one site in plateau cold climate (last).
Figure 6. Inter-comparisons of ISCCP-FD products and GLASS-DSSR products using 2008/2009 summer ASRCOP Pyranometer measurements in temperate continental climate (left) and temperate monsoon climate (right) of China. Black solid line is 1:1 line, red solid line denotes ISCCP-FD fitted line and blue solid line denotes GLASS-DSSR fitted line, respectively.
Figure 7. Histograms of residuals (retrieved DSSR-measured DSSR) distribution at four sites (Naqu, A'rou, Yingke and Miyun) in 2008.
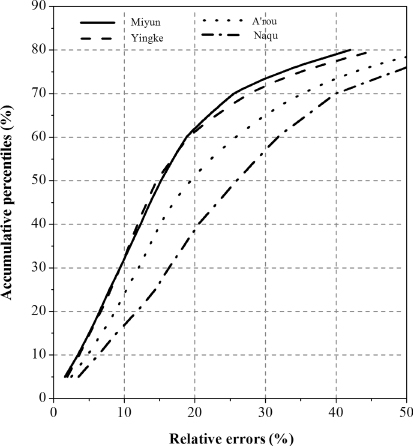
Figure 8. Accumulative percentiles of relative errors at four sites (Naqu, A'rou, Yingke and Miyun).
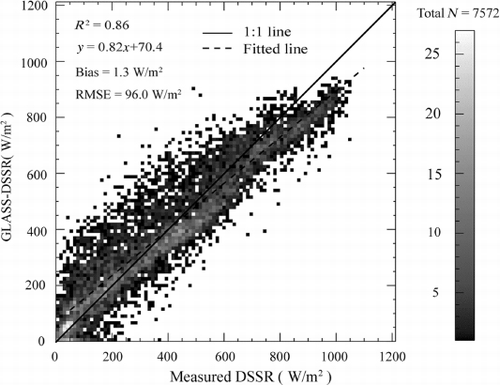
Figure 9. Frequency scatterplot comparing the GLASS-DSSR products with the observed data at Miyun and Yingke in 2008. Grayscale represents the number in each unit bin that the (DSSRMeasured, DSSRGLASS) pair falls into (10 W/m2 increment).

Table 3. Assessment of GLASS instantaneous DSSR using 2008 measurements at Miyun, Yingke A'rou, and Naqu sites.

Reprints and Corporate Permissions

Please note: Selecting permissions does not provide access to the full text of the article, please see our help page How do I view content?

To request a reprint or corporate permissions for this article, please click on the relevant link below:

Academic Permissions

Please note: Selecting permissions does not provide access to the full text of the article, please see our help page How do I view content?

Obtain permissions instantly via Rightslink by clicking on the button below:

If you are unable to obtain permissions via Rightslink, please complete and submit this Permissions form. For more information, please visit our Permissions help page.