1,019
Views
47
CrossRef citations to date
0
Altmetric
Original Articles

A cloud detection method based on a time series of MODIS surface reflectance images

, , , , &
Pages 157-171 | Received 16 Oct 2012, Accepted 06 Aug 2013, Published online: 25 Oct 2013

Figures & data

Table 1. Important components of MOD09A1.
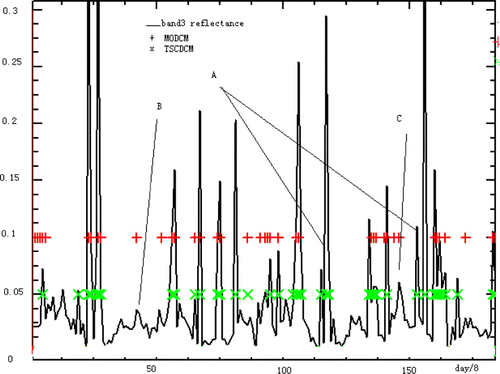
Figure 1. The general flowchart of TSCD algorithm.
Figure 2. One time series (March of 2001 to the end of 2004) of the Changbaishan subset, x-coordinate represents about 180 dates (each per 8 days), y-coordinate represents the band 3 values, MODCM and TSCDCM. ‘+’ at value 0.1 represents MODCM, and ‘x’ at value 0.05 represents TSCDCM.
Figure 3. Time series (March of 2001 to the end of 2004) of the Changbaishan subset.
Figure 4. Time series (March of 2001 to the end of 2004) of the Beijing subset.
Figure 5. A subset of h27v06 from 009 day to 361 day for 2007, size 200×200.
Figure 6. A subset of h11v04 form 009 day to 361 day for 2005, size 200×200.
Figure 7. A subset of h27v06 for date 129 in 2007, size 200×200.
Figure 8. A subset of h27v06 for date 193 in 2007, size 200×200.
Figure 9. Two subsets of h22v07 for date 145 (left) and 193 (right) in 2008 size 200×200, the two RGB images have a different normalization for helping visual distinction between snow and Clouds.
Figure 10. A subset of h13v09 for date 201 in 2008, size 400×400.

Reprints and Corporate Permissions

Please note: Selecting permissions does not provide access to the full text of the article, please see our help page How do I view content?

To request a reprint or corporate permissions for this article, please click on the relevant link below:

Academic Permissions

Please note: Selecting permissions does not provide access to the full text of the article, please see our help page How do I view content?

Obtain permissions instantly via Rightslink by clicking on the button below:

If you are unable to obtain permissions via Rightslink, please complete and submit this Permissions form. For more information, please visit our Permissions help page.