906
Views
39
CrossRef citations to date
0
Altmetric
Original Articles

The emergence and evolution of OpenStreetMap: a cellular automata approach

, , &
Pages 76-90 | Received 08 May 2013, Accepted 18 Sep 2013, Published online: 02 Dec 2013

Figures & data

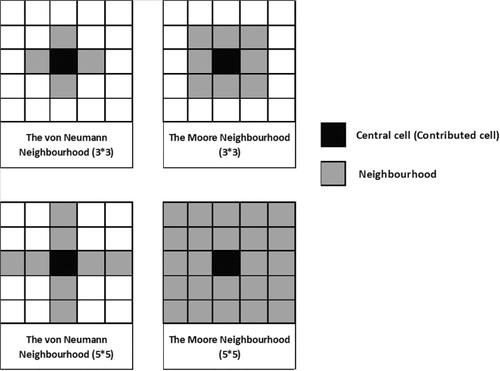
Figure 1. Common representations of CA models and first- and second-order neighborhood functions (von Neumann and Moore neighborhoods).
Figure 2. Spatial extent of the study site, Heidelberg.
Figure 3. The land-use map of Heidelberg provided by ATKIS.
Figure 4. Schematic workflow of CA modeling.
Figure 5. Trends of OSM contributions (nodes).

Table 1. Summary of temporal trends of the contributors and their contributions.

Figure 6. Spatio-temporal representation of contributions for each timestamp.

Table 2. CA calibration results for several iterations and different years.

Figure 7. CA prediction for 2014.

Reprints and Corporate Permissions

Please note: Selecting permissions does not provide access to the full text of the article, please see our help page How do I view content?

To request a reprint or corporate permissions for this article, please click on the relevant link below:

Academic Permissions

Please note: Selecting permissions does not provide access to the full text of the article, please see our help page How do I view content?

Obtain permissions instantly via Rightslink by clicking on the button below:

If you are unable to obtain permissions via Rightslink, please complete and submit this Permissions form. For more information, please visit our Permissions help page.