453
Views
6
CrossRef citations to date
0
Altmetric
Letter

Polarimetric synthetic aperture radar change detection for specific land cover types

, , , , , , & show all
Pages 334-344 | Received 07 May 2013, Accepted 03 Dec 2013, Published online: 02 Jan 2014

Figures & data

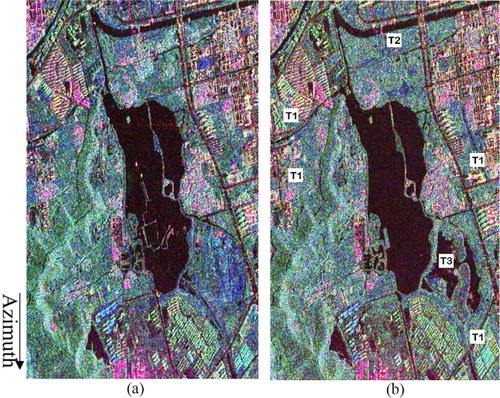
Figure 1. Experimental data-set. (a) Pauli decomposition map, 9 April 2009. (b) Pauli decomposition map, 15 June 2010. Class T1 indicates the change from bare lands to urban areas, class T2 denotes the change from urban architecture to bare lands, and class T3 indicates the change from lawns to water.
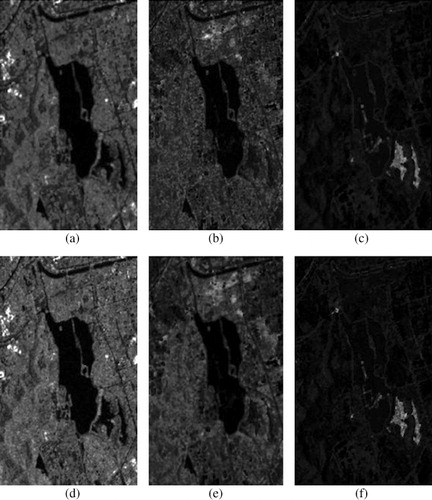
Figure 2. The top images are the difference maps using dp for three change types: (a) class T1, (b) class T2, and (c) class T3. The bottom images are the difference maps using dR for three change types: (d) class T1, (e) class T2, and (f) class T3. Class T1 indicates the change from bare lands to urban areas, class T2 denotes the change from urban architecture to bare lands, and class T3 indicates the change from lawns to water.
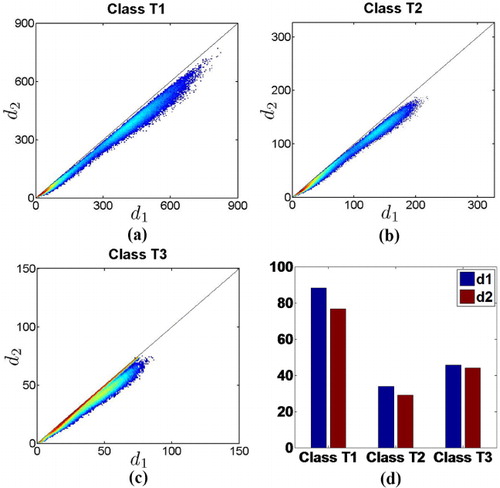
Figure 3. The comparison of d1 and d2 for three change types: (a) class T1, (b) class T2, and (c) class T3. On the abscissa are the d1 values, and the ordinate contains the d2 values. (d) The average of d1 and d2 for all change types.
Figure 4. Color code for each binary mask.

Table 1. Accuracy of change detection.

Reprints and Corporate Permissions

Please note: Selecting permissions does not provide access to the full text of the article, please see our help page How do I view content?

To request a reprint or corporate permissions for this article, please click on the relevant link below:

Academic Permissions

Please note: Selecting permissions does not provide access to the full text of the article, please see our help page How do I view content?

Obtain permissions instantly via Rightslink by clicking on the button below:

If you are unable to obtain permissions via Rightslink, please complete and submit this Permissions form. For more information, please visit our Permissions help page.