563
Views
9
CrossRef citations to date
0
Altmetric
Original Articles

Application of geovisual analytics to modelling the movements of ruminants in the rural landscape using satellite tracking data

, , , &
Pages 579-593 | Received 03 Jul 2013, Accepted 03 Dec 2013, Published online: 02 Jan 2014

Figures & data

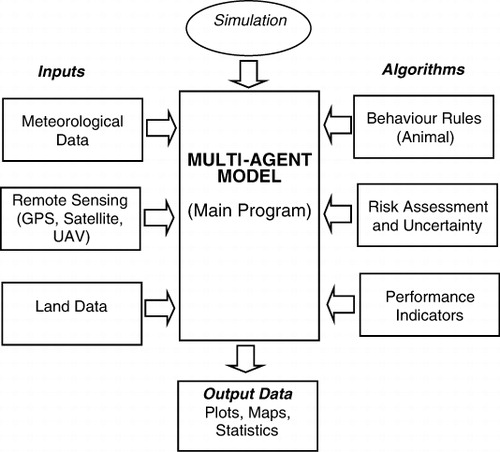
Figure 1. Schematic diagram of a global modelling framework incorporating an ABM for simulating space-time behaviour of ruminants (see Benke et al. Citation2012).
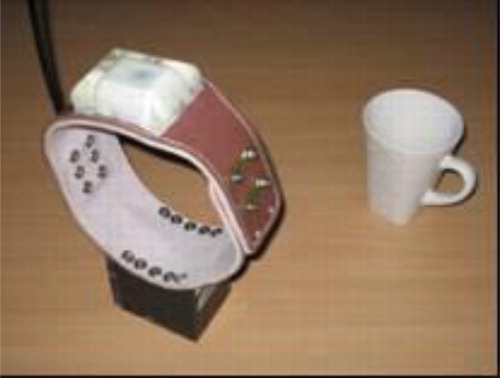
Figure 2. Example of a GPS collar receiver for tracking animal movements (AgTrax II unit from Alana Ecology). Unit consists of antenna and moulding with radio modem, flash memory for up to 65,000 locations and embedded battery pack.
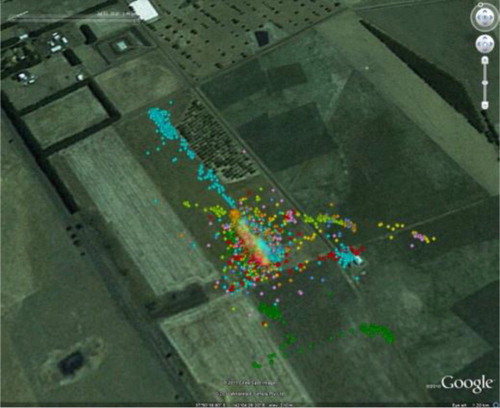
Figure 3. Examples of logged sheep locations over time in a paddock using GPS collars, where each colour tags a specific animal at multiple locations.
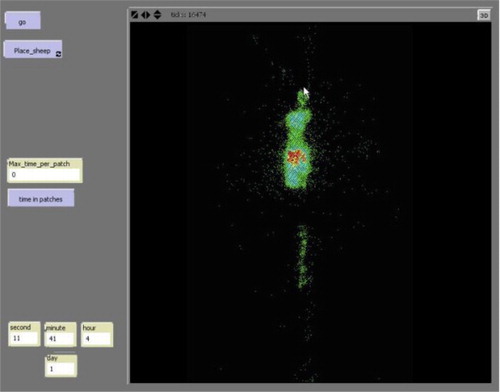
Figure 4. Preferred feeding sites for sheep showing clustering from a prototype ABM using NetLogo software (red indicates high density).
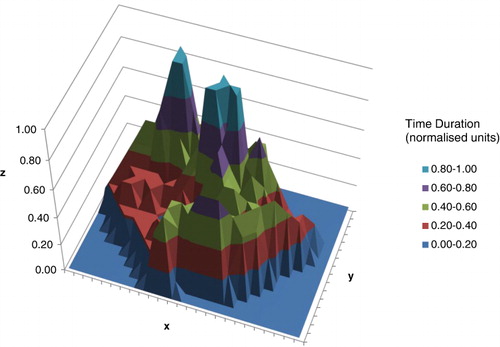
Figure 5. Time duration data represented as an isometric projection showing gathering sites for cows.
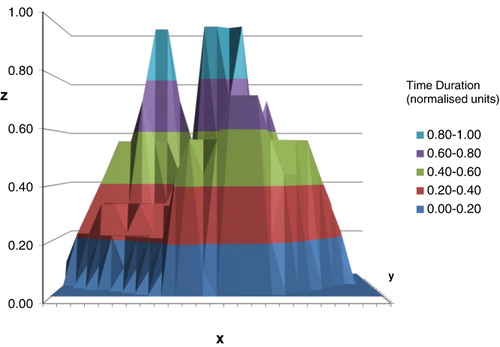
Figure 6. Side elevation of twin peaks showing degree of separation of two excretion sites and peak nitrogen emissions. Estimation of peak full-width at half-maximum for each of the peaks provides two distinct areas for comparative analysis.
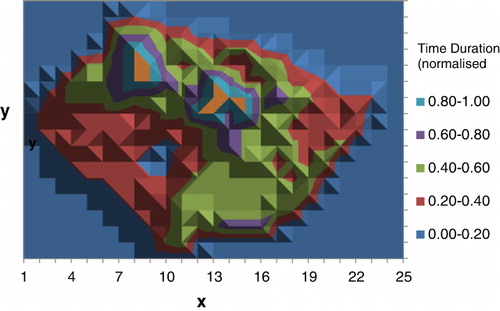
Figure 7. Flat plane representation of sampled data in the form of a contour plot of normalised time duration for the gathering sites of cows. Bright orange areas represent gathering points for urination.
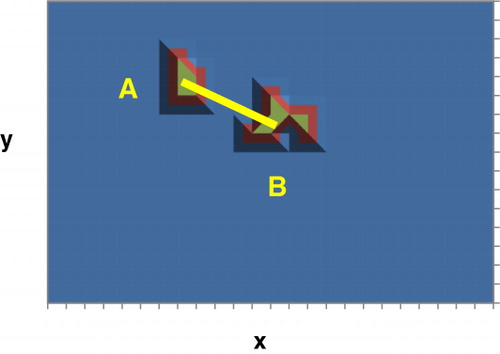
Figure 8. Clusters from the previous figure have been thresholded (T = 0.80) to separate the peaks from the background. The transect (yellow line) shows the distance between the centre-of-mass positions for areas A and B.
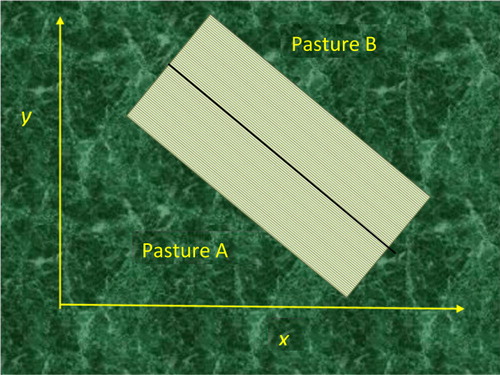
Figure 9. Paddock orientation relative to the global coordinate frame, where Pastures A and B share a common boundary, and represent ryegrass and plantain, respectively (cf. with sheep locations and contextual information from Google Earth). Geometric transformations involving translation and rotation can be applied to align paddock boundaries to be parallel to the global reference frame.
Figure 9. Paddock orientation relative to the global coordinate frame, where Pastures A and B share a common boundary, and represent ryegrass and plantain, respectively (cf. Figure 3 with sheep locations and contextual information from Google Earth). Geometric transformations involving translation and rotation can be applied to align paddock boundaries to be parallel to the global reference frame.

Reprints and Corporate Permissions

Please note: Selecting permissions does not provide access to the full text of the article, please see our help page How do I view content?

To request a reprint or corporate permissions for this article, please click on the relevant link below:

Academic Permissions

Please note: Selecting permissions does not provide access to the full text of the article, please see our help page How do I view content?

Obtain permissions instantly via Rightslink by clicking on the button below:

If you are unable to obtain permissions via Rightslink, please complete and submit this Permissions form. For more information, please visit our Permissions help page.