885
Views
14
CrossRef citations to date
0
Altmetric
Original Articles

Spatiotemporal analysis of land use/cover changes in Nanchang area, China

&
Pages 312-333 | Received 12 Jul 2013, Accepted 09 Feb 2014, Published online: 06 Mar 2014

Figures & data

Figure 1. Location of study area, with RGB composite map from Landsat-5 TM, 2010.

Table 1. Land use/cover categories for which changes were detected during study period.

Figure 2. Land use/cover distribution in study area in 1989 (a), and 2010 (b), derived from Landsat TM data.

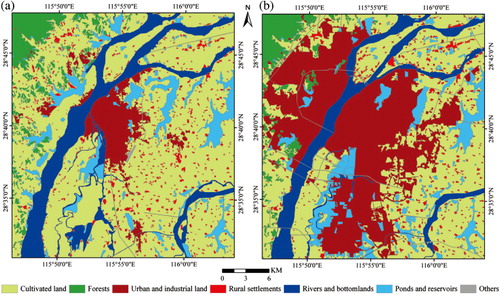
Table 2. Observed sample matrix (confusion matrix), with classifications for 2010 (numbers in bold) and 1989 (numbers in italics).

Figure 3. (a) Persistence, loss, gain and total proportions of LUCC calculated from ; (b) observed transition intensities between categories, compared with uniform intensity that would exist if the change was distributed uniformly over entire spatial extent (Aldwaik and Pontius Citation2012).
Figure 3. (a) Persistence, loss, gain and total proportions of LUCC calculated from Table 3; (b) observed transition intensities between categories, compared with uniform intensity that would exist if the change was distributed uniformly over entire spatial extent (Aldwaik and Pontius Citation2012).

Table 3. Cross-tabulation matrix indicating systematic transition among categories.

Table 4. Changes in number and average area (km2) of patches of each category during 1989–2010 (percentages of the changes were calculated based on category data for 1989).

Figure 4. (a) Geographic distribution of gain, loss and persistence of urban and industrial land during 1989–2010; (b) grid numbers within subranges of density change; (c) cumulative densities of grids versus density values within subranges.
Figure 5. (a) Geographic distribution of gain, loss and persistence of rural settlements during 1989–2010; (b) grid numbers within subranges of density change; (c) cumulative densities of grids versus density values within subranges.
Figure 6. (a) Geographic distribution of gain, loss and persistence of cultivated land during 1989–2010; (b) grid numbers within subranges of density change; (c) cumulative densities of grids versus density values within subranges.
Figure 7. (a) Geographic distribution of gain, loss and persistence of forests during 1989–2010; (b) grid numbers within subranges of density change; (c) cumulative densities of grids versus density values within subranges.
Figure 8. (a) Geographic distribution of gain, loss and persistence of ponds and reservoirs during 1989–2010; (b) grid numbers within subranges of density change; (c) cumulative densities of grids versus density values within subranges.
Figure 9. (a) Geographic distribution of gain, loss and persistence of rivers and bottomlands during 1989–2010; (b) grid numbers within subranges of density change; (c) cumulative densities of grids versus density values within subranges.

Reprints and Corporate Permissions

Please note: Selecting permissions does not provide access to the full text of the article, please see our help page How do I view content?

To request a reprint or corporate permissions for this article, please click on the relevant link below:

Academic Permissions

Please note: Selecting permissions does not provide access to the full text of the article, please see our help page How do I view content?

Obtain permissions instantly via Rightslink by clicking on the button below:

If you are unable to obtain permissions via Rightslink, please complete and submit this Permissions form. For more information, please visit our Permissions help page.