468
Views
12
CrossRef citations to date
0
Altmetric
Original Articles

Spatiotemporal reflectance blending in a wetland environment

, , , &
Pages 364-382 | Received 13 Jul 2013, Accepted 09 Feb 2014, Published online: 06 Mar 2014

Figures & data

Figure 1. Study area of Poyang Lake National Nature Reserve (PLNR), China.

Table 1. Acquisition dates of the input Landsat-5 TM and Terra MODIS images for the customized model.

Figure 2. Flowchart of customized blending model based on ESTARFM. tt refers to target date of blended reflectance image, tm and tn refers to acquisition dates of prior and posterior TM images, tm −  and tm +  refers to acquisition dates of prior and posterior MODIS images for prior TM image, and tn −  and tn +  refers to acquisition dates of prior and posterior MODIS images for posterior TM image.
Figure 3. False color images of observed and blended reflectance: observed TM reflectance (a and d); blended reflectance predicted by customized model (b and e); and blended reflectance from ESTARFM for 28 October 2004 (c and f). Green, red, and near infrared (NIR) bands were assigned to blue, green, and red in images along top row (a–c), and blue, shorter portion of shortwave infrared (S-SWIR), and longer portion of shortwave infrared (L-SWIR) bands were assigned to blue, green, and red in images along bottom row (d–f).

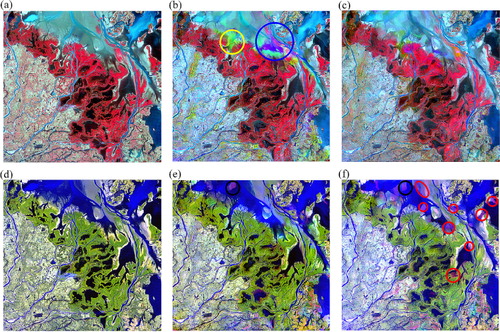
Table 2. AAD and AD between observed reflectance and blended reflectance from the customized model and ESTARFM for 28 October 2004.

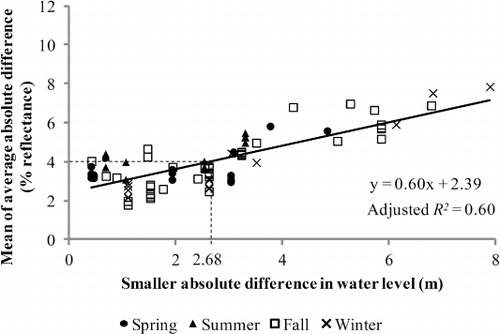
Table 3. Adjusted correlation coefficient (adjusted R 2 ) between factors in input images and AAD between observed and blended reflectance.

Figure 4. Relationship of the mean values of AAD between observed and blended spectra in all bands with smaller absolute difference of water level between prior or posterior dates and target dates.

Table 4. Agreement between observed and blended reflectance with combination of input image sets achieving smallest mean values of AAD for all spectral bands: (a) AAD, (b) AD.

Reprints and Corporate Permissions

Please note: Selecting permissions does not provide access to the full text of the article, please see our help page How do I view content?

To request a reprint or corporate permissions for this article, please click on the relevant link below:

Academic Permissions

Please note: Selecting permissions does not provide access to the full text of the article, please see our help page How do I view content?

Obtain permissions instantly via Rightslink by clicking on the button below:

If you are unable to obtain permissions via Rightslink, please complete and submit this Permissions form. For more information, please visit our Permissions help page.