1,154
Views
28
CrossRef citations to date
0
Altmetric
Original Articles

Agricultural growing season calendars derived from MODIS surface reflectance

, &
Pages 173-197 | Received 16 Aug 2013, Accepted 10 Feb 2014, Published online: 07 Mar 2014

Figures & data

Table 1. A list of the phenological transition date parameters used in this research, accompanied by their biophysical definitions, as well as their algorithm specifications.
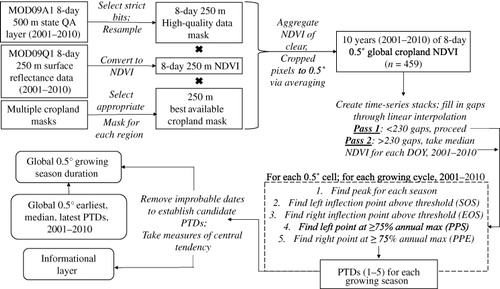
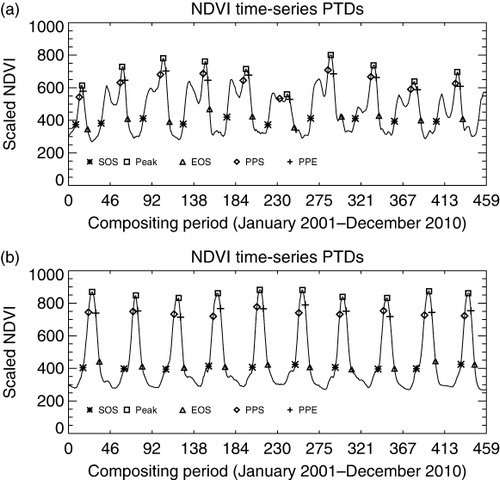
Figure 1. A flowchart depicting the pre-processing and data preparation steps, the basic logic of the PTD extraction algorithm, as well as the steps leading to the generation of the final data products. Intermediate data products and steps are in solid rectangles, actions are connecting arrows accompanied by italicised text, and final data products are in soft-cornered rectangles.
Figure 2. Plots of the gap-filled time series of 8-day composites of scaled NDVI (× 1000), 2001–2010 (46 per year × 10 years = 460 values), from which PTDs were detected. (a) NDVI time series from a location in Southern Kansas, providing an example of a winter wheat dominated landscape, with the SOS being detected in the October-November time period, and the EOS being detected in the June–July time period. The algorithm selects the post-dormancy resumption of growth (Miller Citation1999) of the crop as the peak period, and in 2001 places the SOS in March (contemporaneous with this post-dormancy re-emergence) due to the true SOS taking place in 2000, before the initiation of the time series. (b) NDVI time series from a location in central Indiana, providing an example of a corn/soy mix, with the SOS being detected in April-May, and the EOS being detected in October.
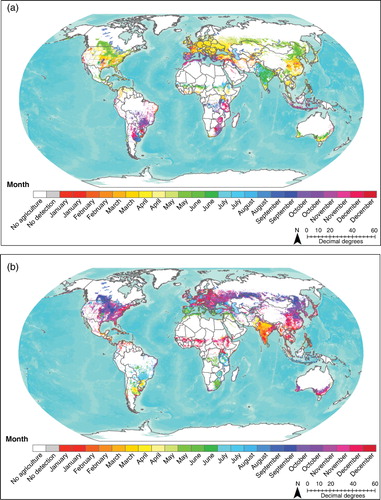
Figure 3. The global median, (a) SOS date, and (b) EOS date, as observed between 2001 and 2010. The PTDs are natively at 0.5°, but the inclusions of even a single 250 m cropped pixel in any of those half-degree grid cells would lead to a large overestimation of cropland extent. In this global view, a cropland indicator mask (GLAM-UMD; unpublished) at 0.05° has been overlaid to provide a more realistic extent of cropland area. Some grid cells (shown in grey) had no detection over 2001–2010, despite having at least some cropland present. If greater than 50% of a grid cell's time series was missing due to insufficient observations (cloud cover presence, low quality observation) that grid was not processed for PTDs.
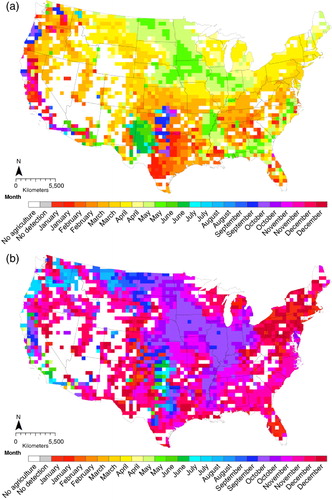
Figure 4. For the CONUS, the median (a) SOS date, and (b) EOS date, as observed between 2001 and 2010. The GSCs are shown at their native resolution (0.5°) without any post-processing application of a finer scale cropland mask to account for true cropland extent estimation (as in and ).
Figure 4. For the CONUS, the median (a) SOS date, and (b) EOS date, as observed between 2001 and 2010. The GSCs are shown at their native resolution (0.5°) without any post-processing application of a finer scale cropland mask to account for true cropland extent estimation (as in Figure 3(a) and 3(b)).
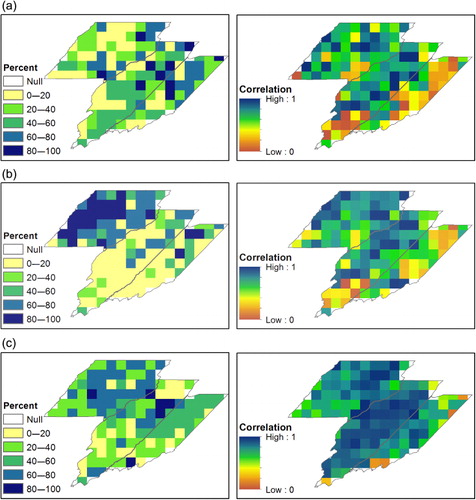
Figure 6. Maps of yearly GSC 0.5° grid cells correlated with different crop progress percentages from state-level USDA-NASS yearly crop progress data, both sets from 2001 to 2010. On the right is the maximum correlation value from the five crop progress percentage thresholds, and on the left is the crop progress threshold for which that maximum correlation value exists. (a) Yearly percent planted correlated with yearly SOS; (b) yearly percent emerged with yearly SOS; (c) yearly percent harvested with yearly EOS. As expected, SOS has higher correlation with emergence than it does with planting. EOS dates, with their consistently high correlation with harvesting dates, show particular sensitivity to interannual variability in phenology.
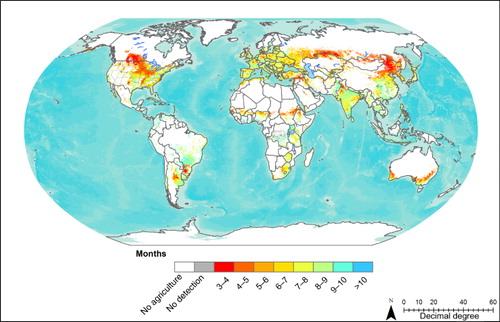
Figure 7. The median duration of the agricultural growing season (SOS to EOS from the same growing season), 2001–2010. As in and , the GLAM-UMD cropland indicator mask at 0.05° is overlaid the native 0.5° GSCs to more accurately represent cropland extent.
Figure 7. The median duration of the agricultural growing season (SOS to EOS from the same growing season), 2001–2010. As in Figure 3(a) and 3(b), the GLAM-UMD cropland indicator mask at 0.05° is overlaid the native 0.5° GSCs to more accurately represent cropland extent.
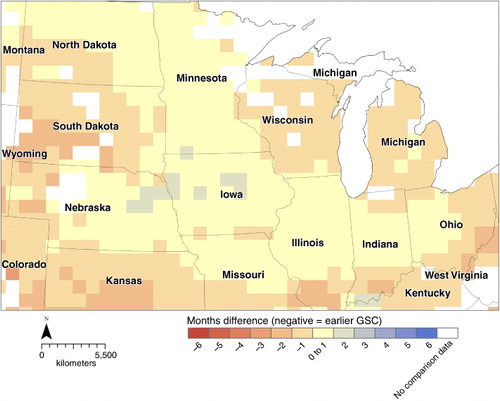
Figure 9. The earliest SOS date (2001–2010) minus a corn & soybean-only compilation of the Start of Planting period (based on maximum harvested area fraction, Monfreda, Ramankutty, and Foley (Citation2008)) for the CONUS’ Corn Belt. A negative number indicates an earlier GSC SOS date relative to the start of the planting period, while a positive number indicates a later GSC SOS date versus the start of the planting period.

Reprints and Corporate Permissions

Please note: Selecting permissions does not provide access to the full text of the article, please see our help page How do I view content?

To request a reprint or corporate permissions for this article, please click on the relevant link below:

Academic Permissions

Please note: Selecting permissions does not provide access to the full text of the article, please see our help page How do I view content?

Obtain permissions instantly via Rightslink by clicking on the button below:

If you are unable to obtain permissions via Rightslink, please complete and submit this Permissions form. For more information, please visit our Permissions help page.