Figures & data
Table 1. Classification or segmentation process for extracting various features from LiDAR datasets.
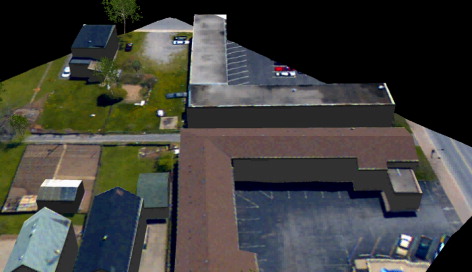
Table 2. Description of the datasets used in this paper.
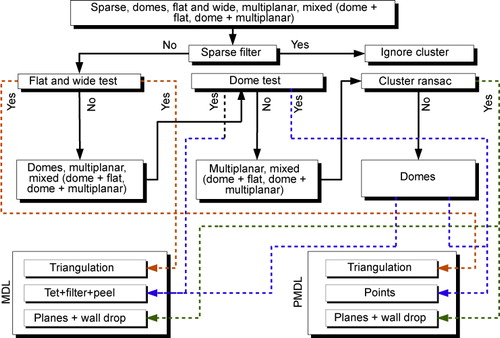
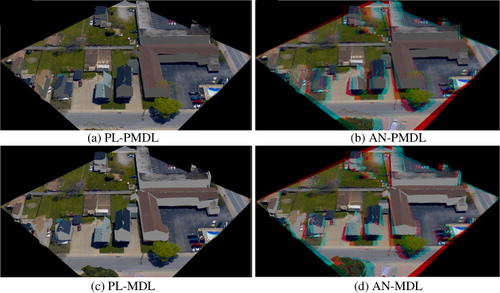
Table 3. Different visualization pipelines studied in this paper.
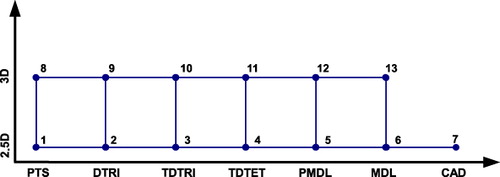
Table 4. Notation, statistic and post-hoc analyzes for Friedman's test and Kruskal–Wallis test.
Table 5. Contingency table describing the efficacy of the heuristics.