581
Views
8
CrossRef citations to date
0
Altmetric
Original Articles

Interpreting map usage patterns using geovisual analytics and spatio-temporal clustering

, &
Pages 599-622 | Received 29 Aug 2013, Accepted 23 Feb 2014, Published online: 26 Mar 2014

Figures & data

Figure 1. (a) A speed map, showing the variable speed of mouse trajectoires. (b) A density map showing the relative mouse interaction. (c) A map showing the stopping locations of a mouse cursor.
Figure 2. The bounding boxes created by a typical user.
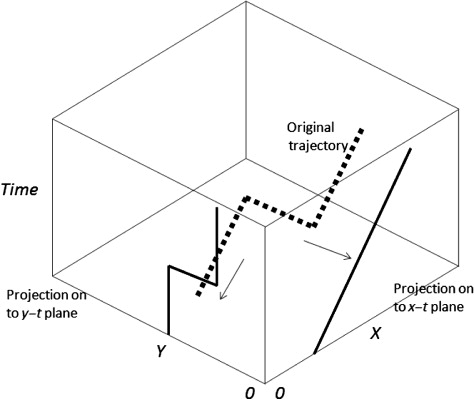
Figure 3. An example of a single trajectory projected on to the walls of a STC to produce two graphs describing the trajectory in perpendicular directions over time.
Figure 4. An annotated view of the STC showing the progress of a single mouse trajectory.
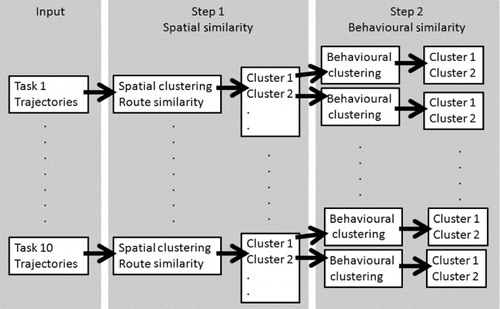
Figure 5. Incremental clustering involves two steps: Spatial clustering followed by Behavioural clustering.
Figure 6. Spatial clusters are shown in each task. Task 1 and 2 contain three clusters each.
Figure 9. STC showing the trajectories corresponding to Task 1 Cluster 2. These trajectories correspond to a novice user due to the bursts of high-speed movement which are evident.
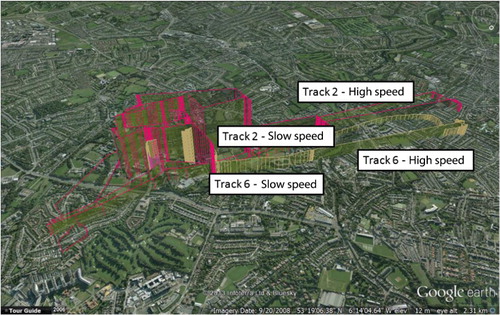
Figure 10. The results of incremental clustering applied to mouse trajectories, showing fast and erratic mouse movements in both the latitude and the longitude directions of movement.
Figure 11. The results of incremental clustering applied to mouse trajectories, slow and controlled mouse movements in both the latitude and longitude directions of movement.
Figure 12. Determining the dominant cluster for User 5, User 10, User 19 and User 26.

Table 1. Description of users and classification of their trajectories after incremental clustering.

Reprints and Corporate Permissions

Please note: Selecting permissions does not provide access to the full text of the article, please see our help page How do I view content?

To request a reprint or corporate permissions for this article, please click on the relevant link below:

Academic Permissions

Please note: Selecting permissions does not provide access to the full text of the article, please see our help page How do I view content?

Obtain permissions instantly via Rightslink by clicking on the button below:

If you are unable to obtain permissions via Rightslink, please complete and submit this Permissions form. For more information, please visit our Permissions help page.