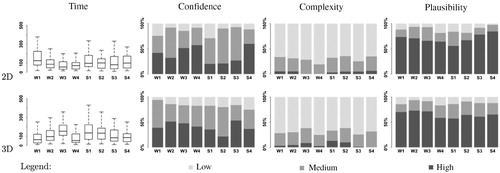
567
Views
9
CrossRef citations to date
0
Altmetric
Original Articles

Quantitative data graphics in 3D desktop-based virtual environments – an evaluation

&
Pages 623-639 | Received 02 Sep 2013, Accepted 20 May 2014, Published online: 30 Jun 2014

Figures & data

Figure 1. Quantitative data and map background (1:25000 © 2014 swisstopo [BA14010]) of the eight different settings (W1–W4, S1–S4) in the 2D (HTML, SVG, and JavaScript, left pairs) and 3D (Google Earth, right pairs) settings.

Table 1. Directed exploratory tasks for Experiment E1 (tasks E1.1–E1.7) and Experiment E2 (task E2.1) referring either to location (L) or, altitude (A), or a combination of location and altitude (LA).
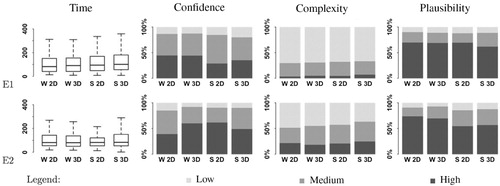
Figure 2. Quantitative data and map background (1:25000 © 2014 swisstopo [BA14010]) of the two different settings (W and S) either in 2D (HTML, SVG, and JavaScript) or 3D (Google Earth).

Table 2. Word categories used to classify an answer/insight into either referring to location, altitude, or a combination of both.
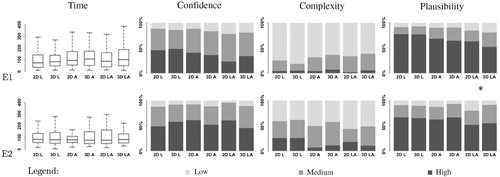
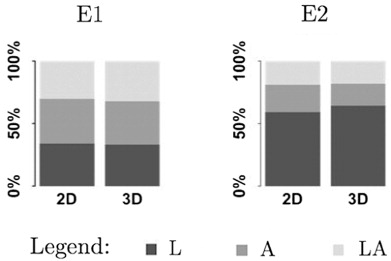
Figure 3. Comparison of the performance measures time, confidence, complexity, and plausibility (columns) between 2D and 3D for the Experiments E1 and E2 (rows). No statistically significant differences were found at a significance level of 95%.
Figure 4. Comparison of the performance measures time, confidence, complexity, and plausibility (columns) between the different reference sets of the insights in 2D and 3D for the Experiments E1 and E2 (rows). Generally, no statistically significant differences (at significance level 95%) were found between 2D and 3D for the different reference sets. The only statistically significant difference was in E1 for plausibility ratings with reference set LA (combination of location and altitude) between 2D and 3D (marked with *; χ2 = 6.09, df = 2, p-value = 0.048).
Figure 5. Comparison of relative quantities of reference set usage (location L, altitude A, or both LA) in the insights reported in E1 and E2.
Figure 6. Comparison of relative quantities of reference set usage (location L, altitude A, or both LA) in the insights reported in E1 compared to the task references (tasks referring to location [tL], tasks referring to altitude [tA], and tasks referring to a combination of location and altitude [tLA]).
Figure 7. Comparing the performance measures time, confidence, complexity, and plausibility for the different settings (W and S) between 2D and 3D in Experiment E1 and E2.
Figure 8. Comparing the performance measures time, confidence, complexity, and plausibility for the different datasets and settings (W1–W4 and S1–S4) between 2D and 3D.

Reprints and Corporate Permissions

Please note: Selecting permissions does not provide access to the full text of the article, please see our help page How do I view content?

To request a reprint or corporate permissions for this article, please click on the relevant link below:

Academic Permissions

Please note: Selecting permissions does not provide access to the full text of the article, please see our help page How do I view content?

Obtain permissions instantly via Rightslink by clicking on the button below:

If you are unable to obtain permissions via Rightslink, please complete and submit this Permissions form. For more information, please visit our Permissions help page.