432
Views
12
CrossRef citations to date
0
Altmetric
Original Articles

Prevalence of the terrain reversal effect in satellite imagery

&
Pages 640-655 | Received 14 Oct 2013, Accepted 04 Jul 2014, Published online: 19 Aug 2014

Figures & data

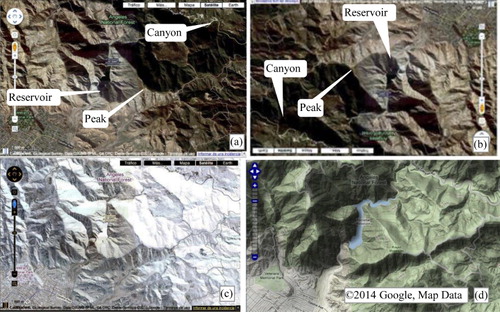
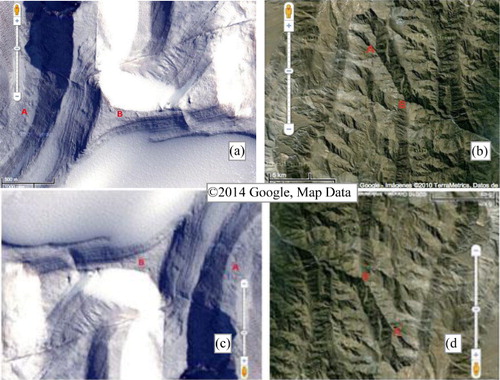
Figure 1. (a) Pacoima Reservoir, Los Angeles National Forest, as seen on Google Maps. Rivers appear to follow ridges and the reservoir lake in the middle appears as a crater lake. (b) 180° rotation of the same image (without any other alterations) can remove the illusion. Now rivers are in the valleys and the reservoir lake ‘makes more sense’. (c) A negative of the image (again, without further alteration) also removes the illusion (not rotated). (d) The reference terrain represents the real landforms.
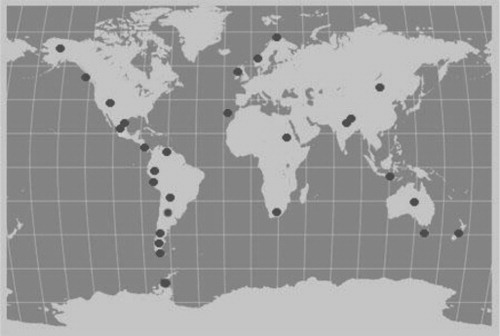
Figure 2. Studied locations (where the screenshots were produced). Not all of the 36 locations are indicated in this illustration, as some of them would occlude each other.
Figure 3. (a) and (b) are example stimuli from the first questionnaire, and (c) and (d) are examples from the second. Example questions for these stimuli are: (a) and (c) Point A is located in a place higher/lower than B (b) and (d) Line AB looks like a valley/ridge.
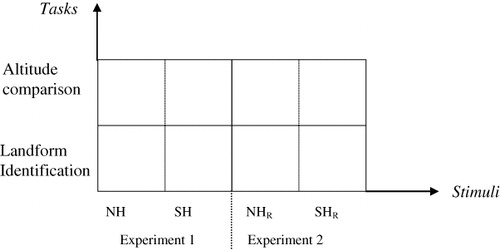
Figure 4. Basic experimental design. NHR: Northern Hemisphere rotated 180°, SHR: Southern Hemisphere rotated 180°.

Table 1. Participant information in the experiments
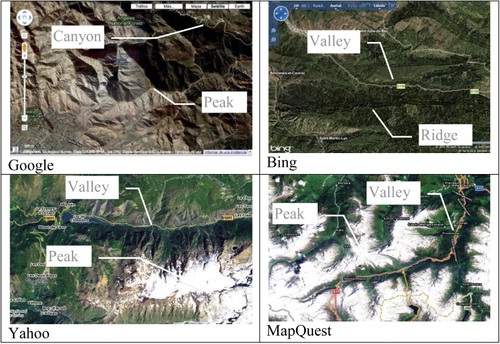
Figure 5. Examples from four different online map providers demonstrating that the terrain reversal effect can be found in many of the current services (web services accessed in June 2014).
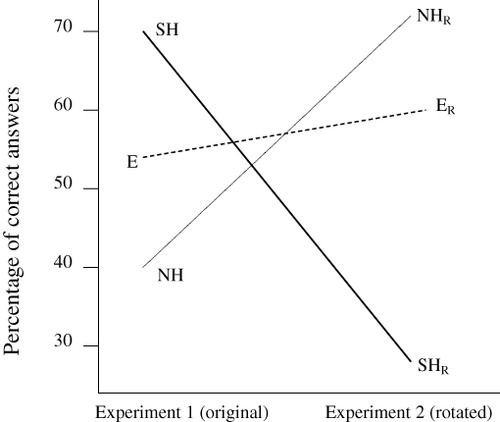
Figure 6. Interaction plot showing how the percentage of correct answers changes over all tasks in the two experiments. NH and SH images have clearly opposite success rates and after the rotation, SH images lead to more incorrect answers while NH images lead to more correct answers. The three images from the equator do not show a similarly strong tendency.
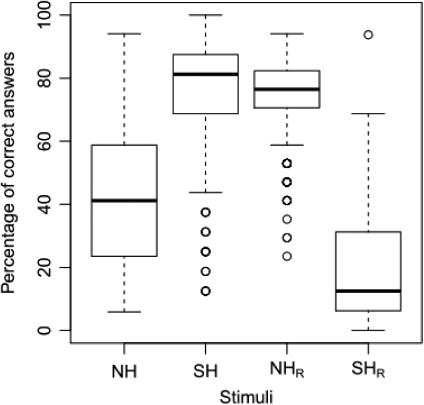
Figure 7. Box-and-whisker plots of raw data showing percentage of correct answers per stimuli group. The solid line inside the box is the median. Boxes cover the interquartile range, whiskers extend 1.5 interquartile range from the boxes, and outliers outside this range are indicated with points.

Table 2. Estimates of fixed-effect parameters of binary generalized linear mixed-effect models on questionnaire data.
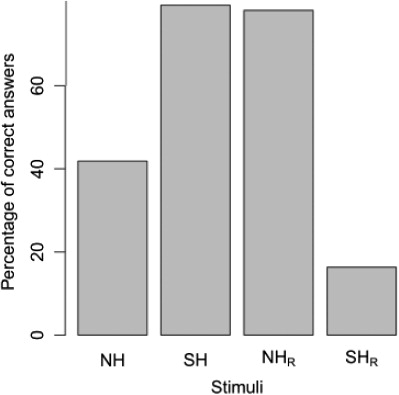
Figure 8. Estimated correct answer rates based on inferential statistics for images from NH and SH before and after the rotation (NHR and SHR). The values were obtained from the generalized linear model estimates presented in and transformed back to the response scores (expected success rate).
Figure 8. Estimated correct answer rates based on inferential statistics for images from NH and SH before and after the rotation (NHR and SHR). The values were obtained from the generalized linear model estimates presented in Table 2 and transformed back to the response scores (expected success rate).

Table 3. Estimates of full model

Table 4. Estimates of the model with gender and geoprofession as predictors.

Reprints and Corporate Permissions

Please note: Selecting permissions does not provide access to the full text of the article, please see our help page How do I view content?

To request a reprint or corporate permissions for this article, please click on the relevant link below:

Academic Permissions

Please note: Selecting permissions does not provide access to the full text of the article, please see our help page How do I view content?

Obtain permissions instantly via Rightslink by clicking on the button below:

If you are unable to obtain permissions via Rightslink, please complete and submit this Permissions form. For more information, please visit our Permissions help page.