287
Views
1
CrossRef citations to date
0
Altmetric
Original Articles

Channeling the water data deluge: a system for flexible integration and analysis of hydrologic data

, &
Pages 272-299 | Received 07 Oct 2014, Accepted 16 Mar 2015, Published online: 28 Apr 2015

Figures & data

Figure 1. Workflow for exploratory analysis of hydrologic data.
Figure 2. Overview of HydroCloud system architecture.
Figure 3. Overview of components in a document database.
Figure 4. HydroCloud document database schema.

Table 1. Data dictionary for HydroCloud database.

Figure 5. ETL workflow for processing NWIS stream flow data.
Figure 6. ETL workflow for processing watershed boundary GIS files.
Figure 7. ETL workflow for processing Stage IV precipitation data.
Figure 8. Example precipitation and stream flow visualization created from sample database query.
Figure 9. Overview of HydroCloud web service architecture.
Figure 10. Example web service result showing Stage IV precipitation JSON return.
Figure 11. HydroCloud web interface showing NWIS stream gauge locations and NEXRAD radar data.
Figure 12. HydroCloud web interface showing a plot of stream (top) and precipitation data (bottom).
Figure 13. Response time for HydroCloud web services.

Table 2. Sites selected for analysis of hydrologic response using the HydroCloud web interface.
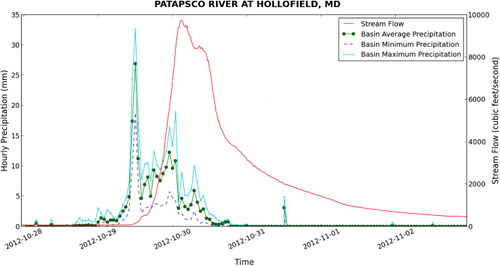
Figure 14. Hydrograph and precipitation statistics for the Patapsco River at Hollofield, MD for Hurricane Sandy (29 October 2012).
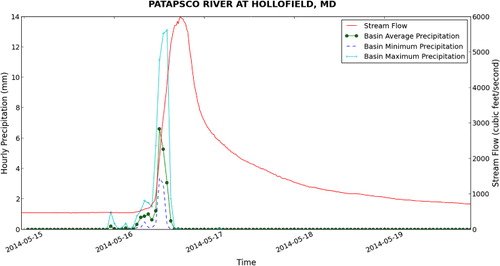
Figure 15. Hydrograph and precipitation statistics for the Patapsco River at Holofield, MD for May 2014.
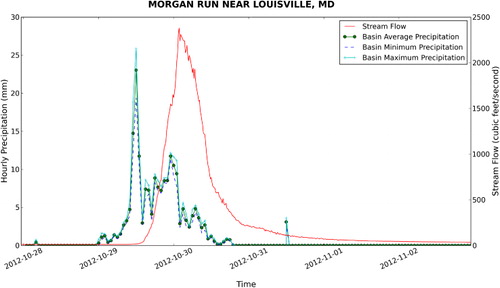
Figure 16. Hydrograph and precipitation statistics for Morgan Run near Louisville, MD Hurricane Sandy (29 October 2012).
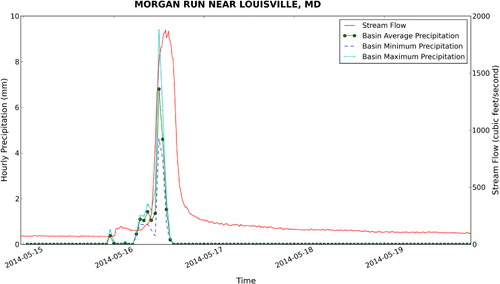
Figure 17. Hydrograph and precipitation statistics for Morgan Run near Louisville, MD for 16 May 2014.

Table 3. Statistical significance of relationships.

Figure 18. The effect of percent impervious area on the index of hydrologic alteration. Based on data for 29 October 2012 (Hurricane Sandy) and 17 watersheds in central Maryland Piedmont.
Figure 19. The effect of watershed area on percent runoff. Percent runoff is calculated as the ratio of total stream discharge to the total volume of precipitation during Hurricane Sandy.

Reprints and Corporate Permissions

Please note: Selecting permissions does not provide access to the full text of the article, please see our help page How do I view content?

To request a reprint or corporate permissions for this article, please click on the relevant link below:

Academic Permissions

Please note: Selecting permissions does not provide access to the full text of the article, please see our help page How do I view content?

Obtain permissions instantly via Rightslink by clicking on the button below:

If you are unable to obtain permissions via Rightslink, please complete and submit this Permissions form. For more information, please visit our Permissions help page.