Figures & data
Table 1. Temperature data (°C) for the QTP for four different IPCC5 RCPs.
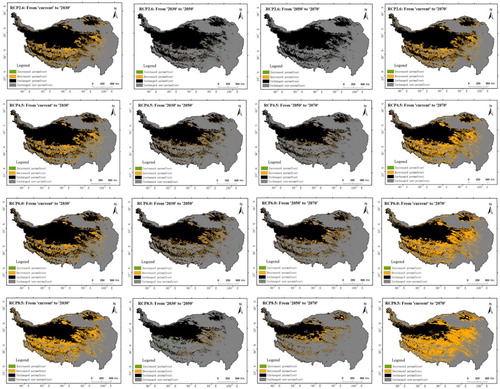
Table 2. Total areas of permafrost on the QTP for each period for the four RCPs (×106 km2).
Table 3. The rate of permafrost degradation on the QTP during each period for the four RCPs (%). ‘+’ indicates permafrost degradation; ‘–’ indicates permafrost increase.
Table 4. The areas (×103 km2) of future permafrost changes for the four RCPs on the QTP.
![Figure 3. Spatial distribution of future permafrost changes (from now to 2030, from 2030 to 2050, from 2050 to 2070, from 2030 to 2050, and from now to 2070) on the QTP for four RCPs. ‘Increased permafrost’ indicates seasonally frozen ground or persistently nonpermafrost conditions that have changed to permafrost. ‘Decreased permafrost’ represents permafrost that has degraded to nonpermafrost. ‘Unchanged permafrost’ and ‘Unchanged nonpermafrost’ means persistent permafrost and nonpermafrost conditions, respectively.](/cms/asset/f39fb055-cf8e-4626-be72-6ad22e8cea49/tjde_a_1041431_f0003_c.jpg)