Figures & data
Figure 1. Conceptual schema of the EGIP platform.
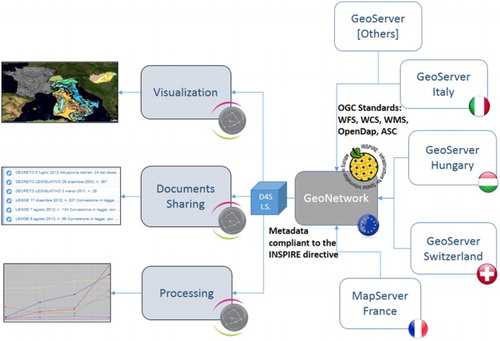
Figure 2. The GeoExplorer portlet for accessing EGIP data.
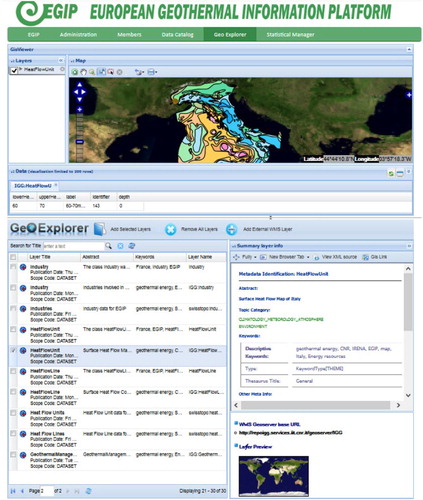
Figure 3. The D4Science interface for data processing.
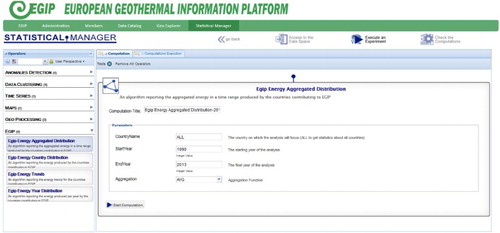
Figure 4. D4Science social networking facilities: (a) the list of user events and news, (b) file-system storage and sharing area (Workspace).
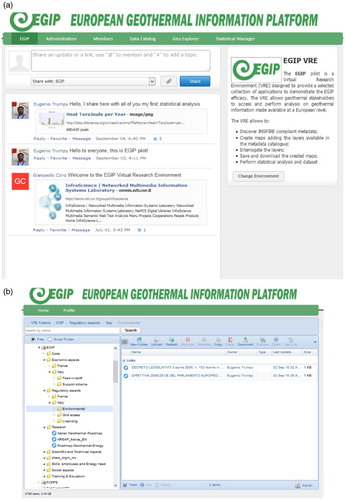
Table 1. The list of data in our prototype e-Infrastructure for EGIP.
Figure 5. Organization of the D4Science Workspace in EGIP.
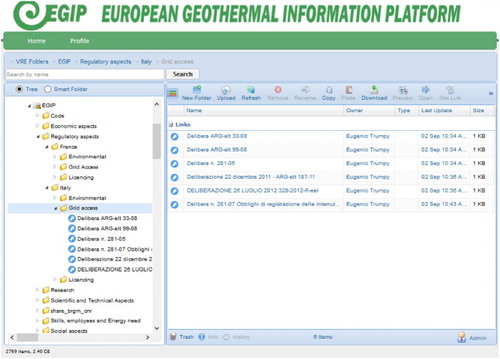
Figure 6. The EGIP metadata catalogue based on the GeoNetwork web interface, accessed through the D4Science web portal for EGIP.
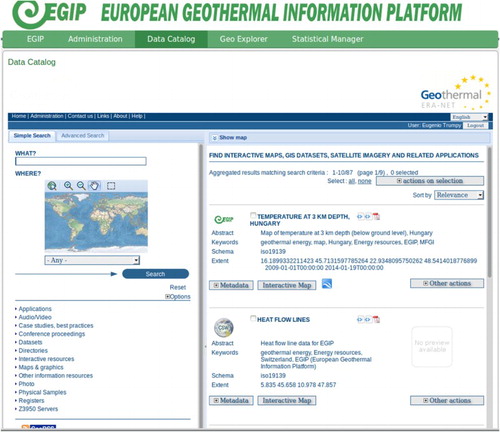
Figure 7. The D4Science GeoExplorer used to visualize heterogeneous data in the EGIP data catalogue.
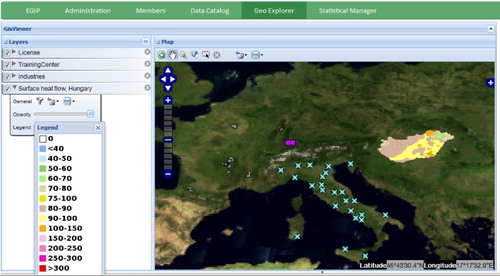
Figure 8. Visualization of the summary table in GeoExplorer, with details on values for Italy.
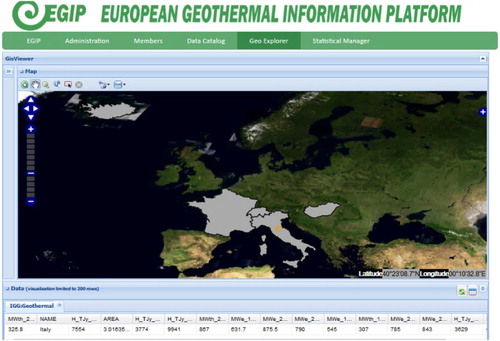
Table 2. Summary table periodically produced by aggregating information on the D4Science GeoNetwork.
Figure 9. Example of the configuration of the energy aggregated distribution algorithm, with corresponding output. A simulated summary table is reported because of privacy issues.
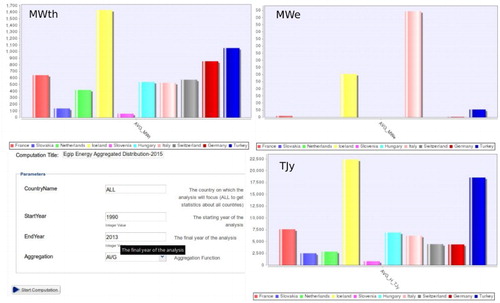
Figure 10. Example of configuration of the energy 5-year distribution algorithm, with corresponding output using a simulated summary table.
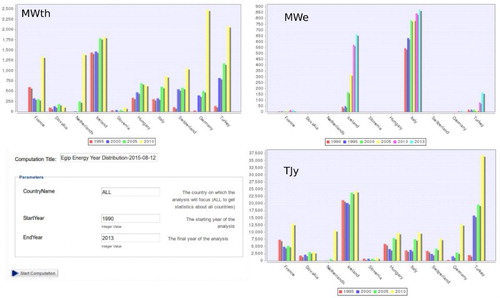
Figure 11. Example of configuration of the energy trends algorithm, with corresponding output using a simulated summary table.
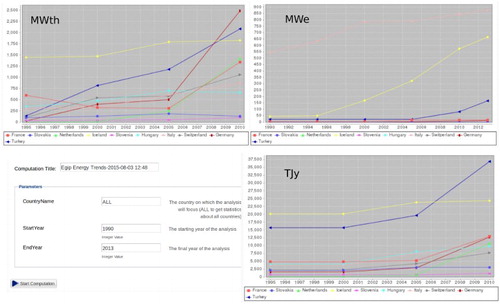
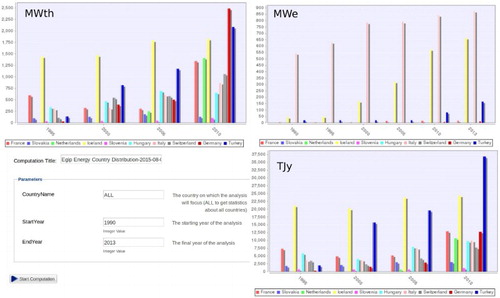
Figure 12. Example of configuration of the energy per country distribution algorithm, with corresponding output using a simulated summary table.