Figures & data
Figure 1. Landsat scenes compared with the 1° × 1° data tiles employed in the EO Data Cube. The Landsat scenes capture Brooks Island in Lake Eyre in 2009. The spatial footprint of Landsat scenes changes over time, while the data tiles maintain a constant footprint.
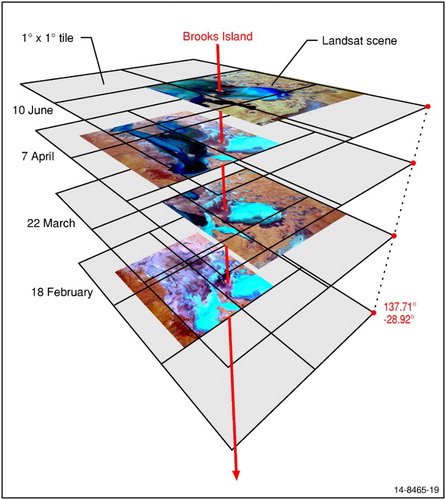
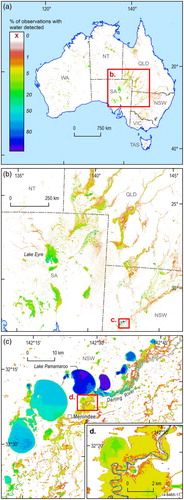
Figure 2. Landsat observations of surface water across Australia, expressed as a percentage of the 27 years of observations for every 25 m pixel. (a) The extensive arid areas are clearly identified (colour key applies to all figures). (b) The highly ephemeral character of rivers and lakes and diffuse flow patterns of rivers are evident. (c) The Menindee Lakes water storage contrasts with the surrounding low-relief landscape that experiences highly infrequent but extensive occurrence of surface water. (d) An example of the fine-scale resolution of observations for the Darling River floodplain.