Figures & data
Figure 1. (a) The boundary of The Netherlands overlaid with ECMWF ERA-Interim gridded dataset and the existing location of wind turbines and (b) the close-up view of the locations of wind turbines in the selected grid cells (red box in (a)).
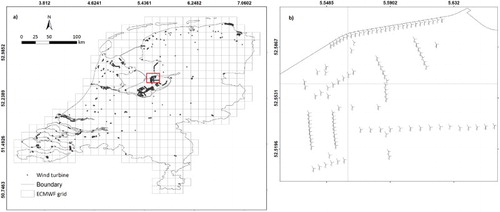
Figure 2. Overall analytical workflow for extracting multi-dimensional wind profile patterns.
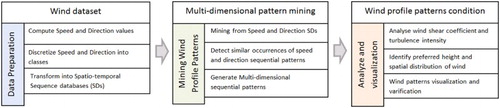
Figure 3. (a) Gridded ERA-Interim for the whole study area and point features representing the centre of grid cells and (b) the dimensional information which comprise latitude, longitude, time, pressure levels, u and v for a single point (point in the grey box in (a)).
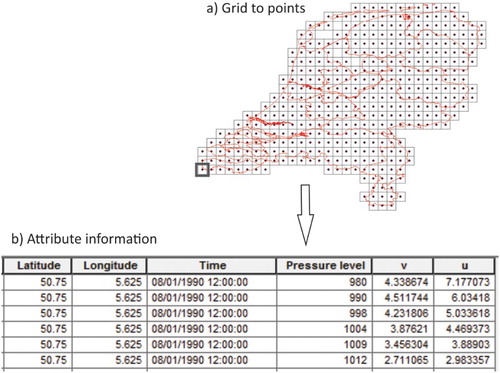
Table 1. Wind speed and direction classes.
Figure 4. The MDSPM workflow.
Table 2. Threshold values of WSC (α) and TI for major wind condition classification.
Figure 5. Total occurrences for (a) wind speed classes and (b) wind direction classes.
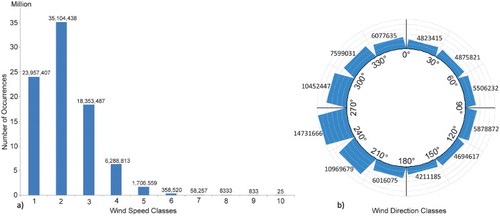
Figure 6. The extracted wind profile patterns and their number of occurrences (absolute (F) and relative (R) frequencies) obtained from the MDSPM process.
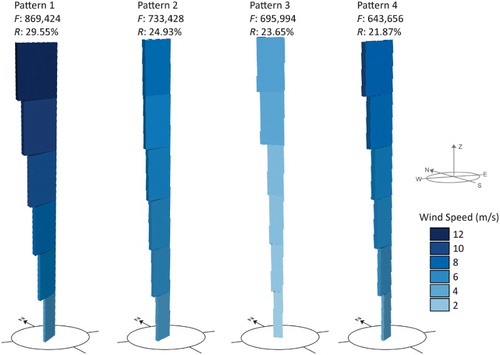
Figure 7. Circular histogram of the wind profile patterns for each month of the year and season.
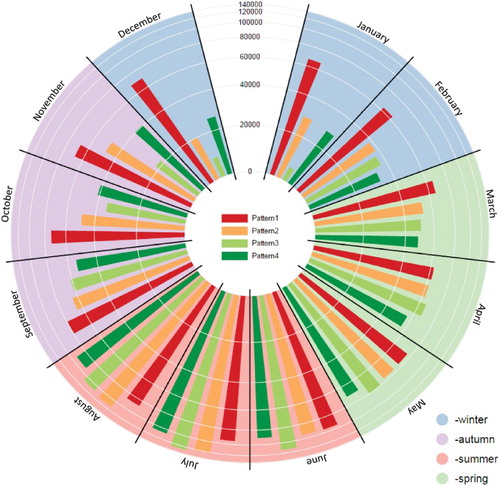
Figure 8. (a) Wind shear coefficient at four instantaneous hours (0, 6, 12 and 18 h) for each wind profile pattern at six different height intervals and (b) Wind shear coefficient for each wind profile pattern at six different height intervals for every month of the year.
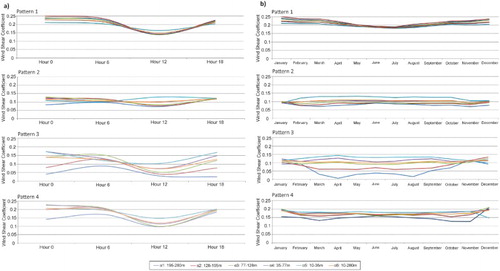
Figure 9. (a) Turbulence intensity at four instantaneous hours (0, 6, 12 and 18 h) for each wind profile pattern at six different heights and (b) Turbulence intensity for each wind profile pattern at six different heights for every month of the year.
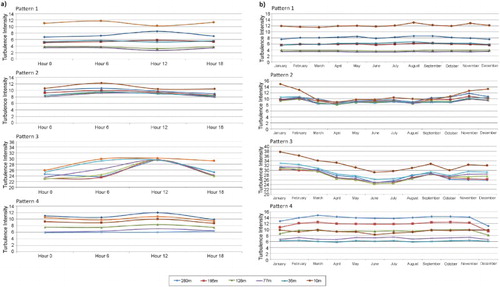
Table 3. Selected mean of WSC and TI for wind patterns.
Figure 10. The wind patterns distribution based on their height and the percentage of occurrences over time in each grid cell overlaid on top of wind turbine locations.
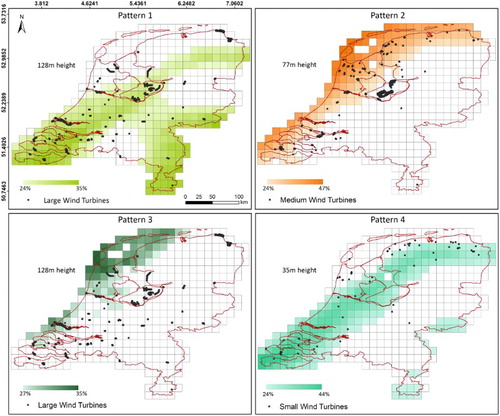
Figure 11. The percentage of overlap between current wind turbine locations and the geographic distribution of the mined wind profile patterns.
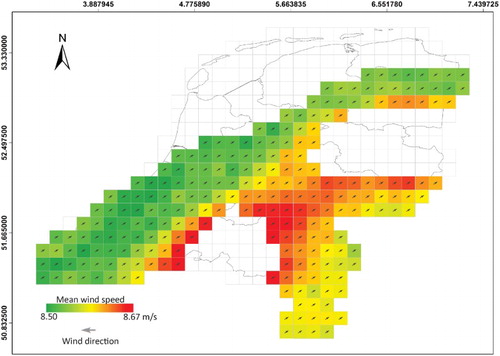
Figure 12. The geographical distribution of mean wind speed and wind direction for pattern 1 at a 128 m height from the surface.