Figures & data
Table 1. Principle space agencies with missions collecting data for global data sets.
Table 2. Examples of sensors used to collect data for global data sets.
Figure 1. Frequency of commercial acquisitions in 2015 (Geocento Citation2016).
Table 3. Examples of portals serving global data sets.
Figure 2. The GEOSS portal architecture which allows users to connect to existing data sets.
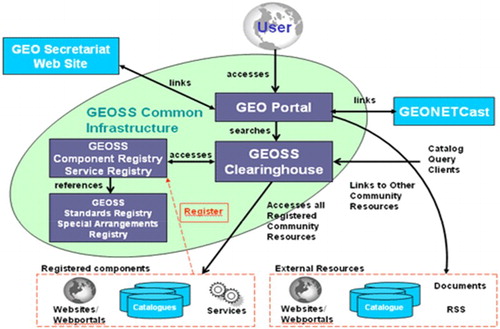
Table 4. Organisations processing EO data to create global data sets.
Table 5. The evolution of global DEMs (compiled from several sources).
Table 6. Accuracy of SRTM DEM determined from ground truth. All quantities represent 90% errors in meters.
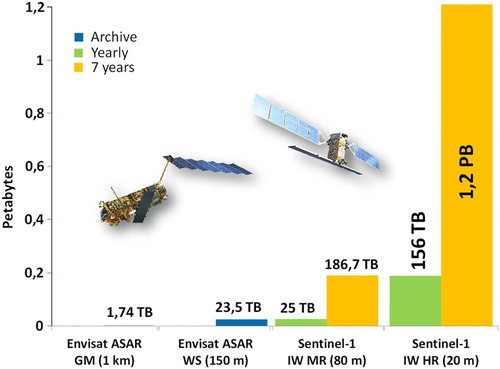
Figure 3. Growth of data volume from ENVISAT ASAR to Sentinel-1 (Wagner Citation2015).