Figures & data
Figure 1. (a) Typical textbook illustration of a planet’s orbit and (b) Earth’s actual orbital.
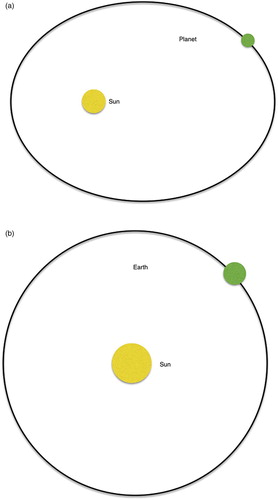
Figure 2. Perspective view of Earth’s orbit creates illusion of ellipse with Sun at center.
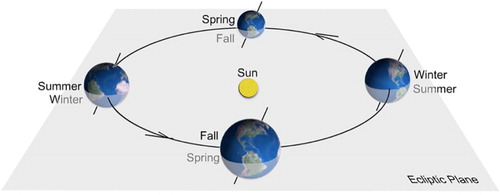
Figure 3. (a) Confusing conical gesture and (b) Inclined cylindrical gesture, which is correct.
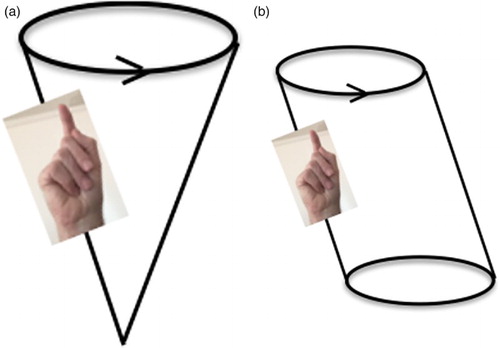
Figure 4. Giant COLLADA models in Google Earth. Image source: NASA.
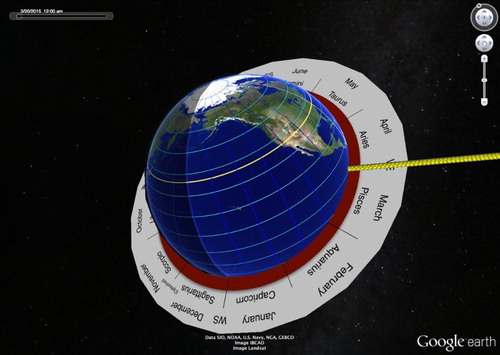
Figure 5. The API version interface. Image source: NASA.
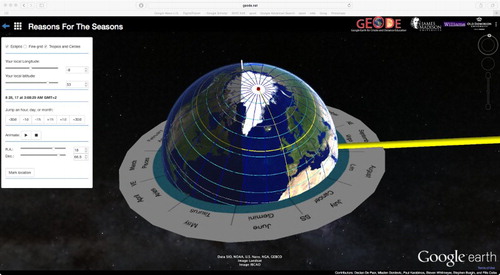
Figure 6. View of southernmost midnight Sun on the northern summer solstice in Google Earth. The location is Grimsey Island, Iceland through which the Arctic Circle passes. ©2016, Google Inc. Image sources: SIO, NOAA, US Navy, NGA, GEBCO, IBCAO, DigitalGlobe, Landsat.
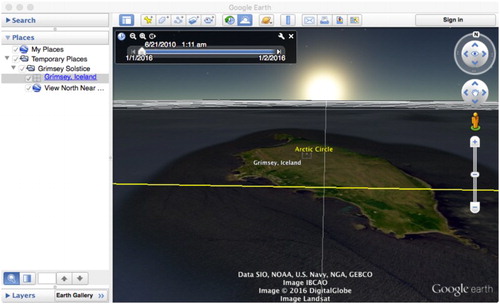
Figure 7. Students can zoom in on home. Yellow lines marking our university can be easily changed to reader’s location in the API version and with KML code in the desktop version. ©2016, Google Inc. Image source: NASA.
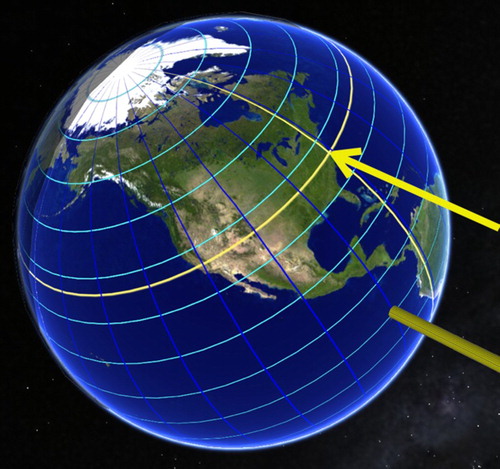
Figure 8. Correct answers in pre-test (horizontal) and post-test (vertical). Blue triangles represent students who improved, magenta diamonds unchanged, yellow triangles worsened. Identical scores numbered and nudged for visibility.
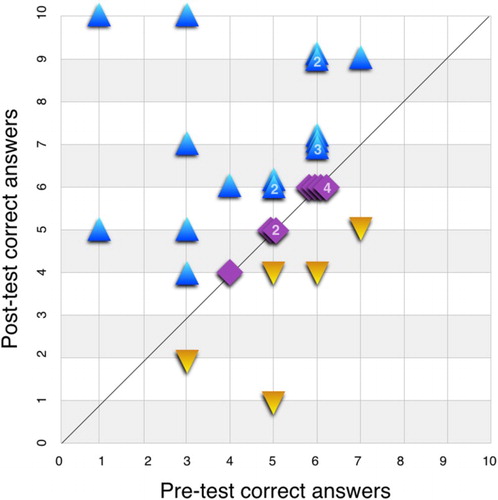
Table 1. Raw data from .
Figure 9. (a) Seasonal variations of noon insolation on Mars. Blue=least insolation, red=most. (b) image wrapped around Google Mars. Beige plane is the ecliptic. ©2016, Google Inc. Image source: Caplinger (Citation1994).
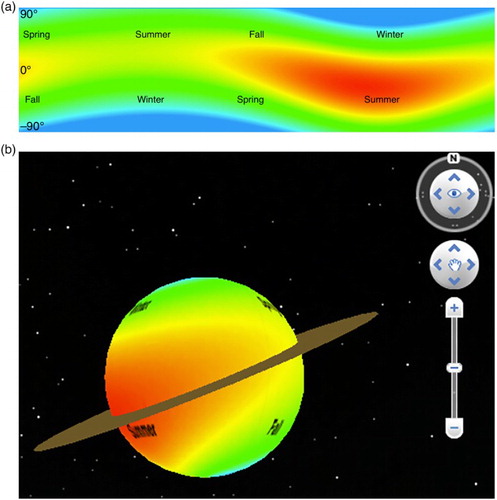
Figure 10. (a) Elevated Google Earth placemarks represent varying distances to stars in asterism such as Big Dipper. (b) Blue Marble can be blanked out to concentrate attention on r.a./dec grid. Google Earth style elements can be varied (black). Current azimuth and zenith angle (90°-altitude) of a star may be determined from the heading and map length of the Google Earth ruler set to degrees (purple arc). ©2016, Google Inc. Image source: NASA.
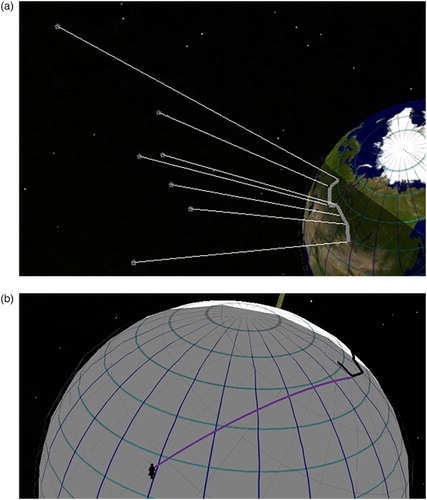
Figure 11. (a) Altitude of the midday Sun is 90° - zenith angle which is measured along the meridian (yellow) from the student’s location to the sunbeam. (b) Measuring azimuth and altitude with Google Earth ruler tool. (c) Spreading the time slider’s thumbs reveals the change in az/alt with time. Blue arcs are sequential solar zenith angles. ©2016, Google Inc. Image sources: SIO, NOAA, US Navy, NGA, GEBCO, Landsat.
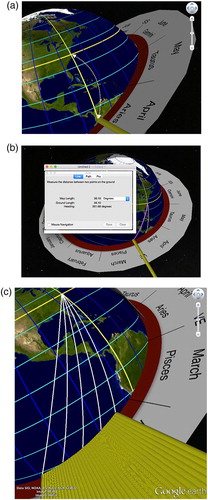
Figure 12. Paper plot exercise. Inclined stereographic net centered on ecliptic pole. Latitude of Norfolk is dashed. VE = Vernal Equinox. Tracing overlay rotates about a central thumbtack. Orange dot represents direction of Sun, gray = nighttime. Sunrise midday, sunset, and midnight on May 16 are marked.
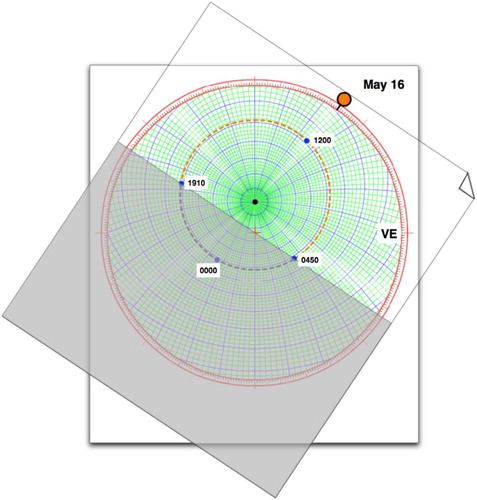
Figure 13. Relating geocentric stereographic projection to heliocentric terrestrial orbits drawn on a sheet of poster paper. Gray line joins Earth's perihelion to aphelion.
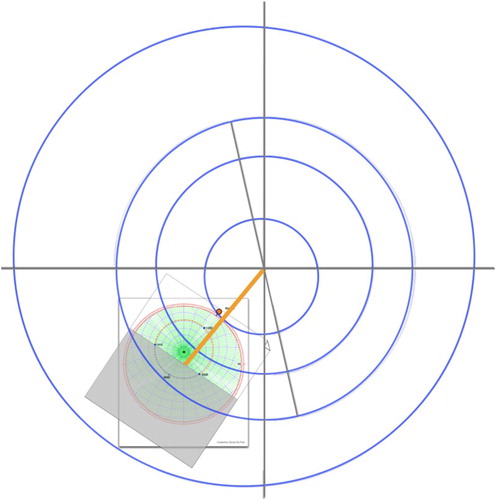
Figure 14. Google Earth model of Solar System with both orbits and globe sizes to a scale of 1: 1 million. (a) Orbits of the terrestrial planets, (b) Sun centered on ODU Planetarium and (c) Earth model on Outer Banks NC.
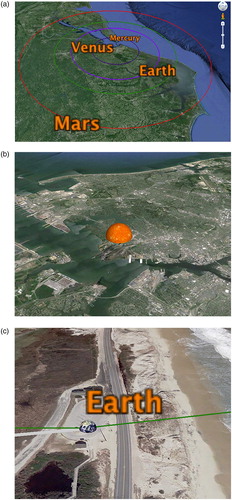
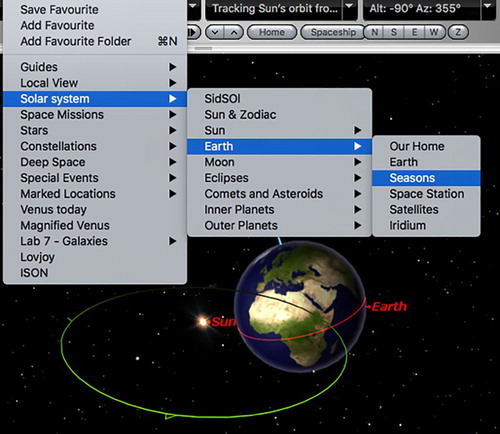
Figure 15. Starry Night Pro has a favorite menu item dealing with the seasons.