
Figures & data
Table 1. Descriptive information of the study sites.
Table 2. Satellite products used in the study.
Table 3. Description of the six water stress factors.
Table 4. Formulation of the statistics used to compare estimated (GPP′i) and reference (GPPEC) GPP.
Figure 1. Temporal variation of ε (black) and ε′i (red) in ES-LMa. From top to bottom: i = 1, 2, 3, 4, 5, and 6.
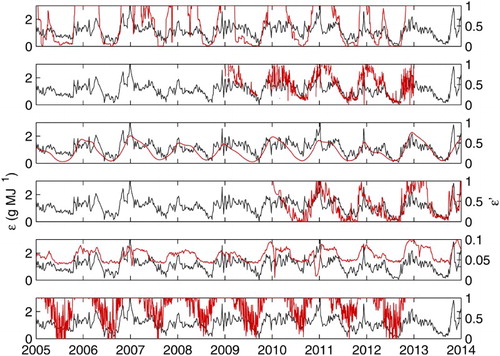
Table 5. Coefficients of determination (R2) between water stress factors (ε′) and reference light use efficiency (ε).
Figure 2. Temporal variation of GPPEC (black), GPP′0 (gray), and GPP′i (red) in ES-LMa. From top to bottom: i = 1, 2, 3, 4, 5, and 6.
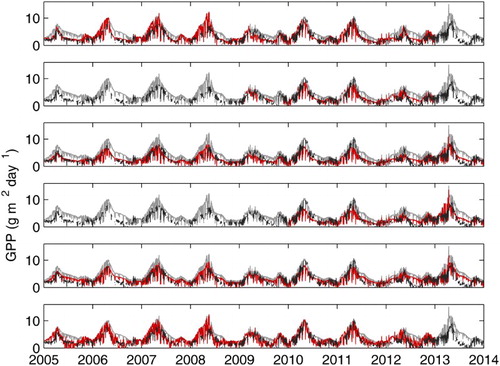
Table 6. Statistics of the evaluation of water stress factors by comparing GPP′i with GPPEC. GPP0 refers to the GPP calculated by means of Equation (3) without ε′i.
Supplemental material