Figures & data
Figure 1. Temporal coverage of five satellite datasets (GOME/ERS-2 (H), SCIAMACHY (S), OMI (O), GOME-2/METOP_A (A) and GOME-2/METOP_B (B)) (left) and the spatial distribution of six regions (right) over China (the insert caption is Nanhai, China).
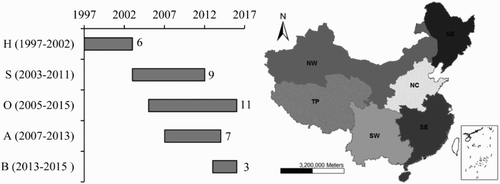
Table 1. Numbers and percentages of grids at five levels for each dataset within its temporal coverage.
Figure 2. Temporal series of annual and seasonal average TNCs from five datasets over China during 1997–2015, the bar charts represent the multiple-year average TNC, and the curves represent the temporal series of average annual TNC. The black (grey) solid mark represents the highest level (abrupt reduction) of annual TNC. Unit: 1015 molecules cm−2. GOME/ERS-2 (H), SCIAMACHY (S), OMI (O), GOME-2/METOP_A (A) and GOME-2/METOP_B (B).
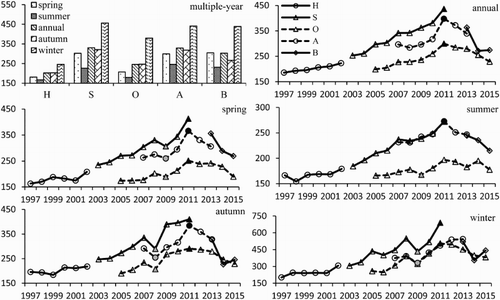
Figure 3. Temporal series of annual TNCs from five datasets in six regions (NC, North China; SE, Southeast; NE, Northeast; SW, Southwest; NW, Northwest; TP, Tibetan Plateau) during 1997–2015. The curves represent the temporal series of average annual TNCs, and the bar charts represent the multiple-year average annual TNC from each dataset in six regions. The solid mark represents the highest level (abrupt reduction) of the annual TNC (Unit: 1015 molecules cm−2). GOME/ERS-2 (H), SCIAMACHY (S), OMI (O), GOME-2/METOP_A (A) and GOME-2/METOP_B (B).
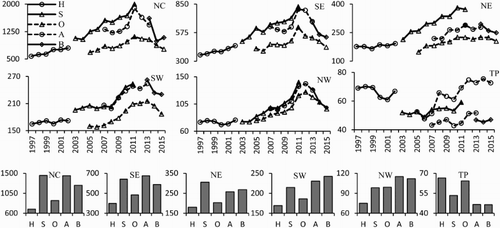
Figure 4. Temporal series of seasonal TNCs from five datasets in six regions from 1997 to 2015, it represents temporal series of seasonal TNCs in NC, SE, NE, SW, NW and TP from left to right, and regional TNCs in spring, summer, autumn and winter from the upper to the bottom panel. The black (grey) solid circle represents the highest level (abrupt reduction) of the seasonal TNCs. Unit: 1015 molecules cm−2. GOME/ERS-2 (H), SCIAMACHY (S), OMI (O), GOME-2/METOP_A (A) and GOME-2/METOP_B (B).
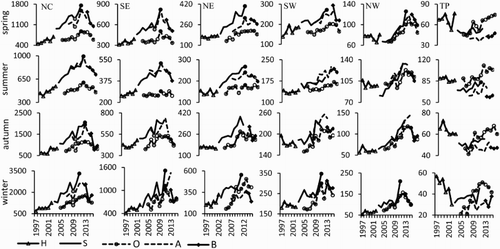
Figure 5. Spatial maps of changing rate and corresponding significance levels of TNC over China, unit of the trend: 1015 molecules cm−2 yr−1, Sig represents the significance level. GOME/ERS-2 (H), SCIAMACHY (S), OMI (O), GOME-2/METOP_A (A) and GOME-2/METOP_B (B).
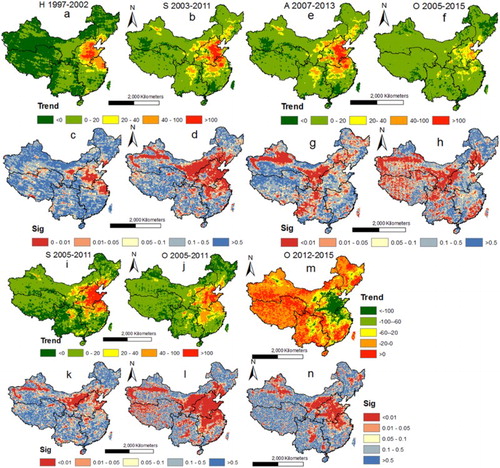
Figure 6. Scatter plots and regression results between four pairs of datasets based on the multiple-year average annual TNC at the country level, the vertical axis (y) is for TNC from O, O, S, S and the horizontal axis (x) is for TNC from A, B, A, O, respectively. Unit: 1015 molecules cm−2. GOME/ERS-2 (H), SCIAMACHY (S), OMI (O), GOME-2/METOP_A (A) and GOME-2/METOP_B (B).
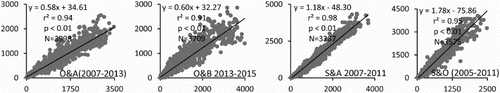
Table 2. Parameters of regression between different datasets in six regions.
Figure 7. Spatial distribution of numbers of missing values on grid scale within each dataset under the predefined rule. GOME/ERS-2 (H), SCIAMACHY (S), OMI (O), GOME-2/METOP_A (A) and GOME-2/METOP_B (B).
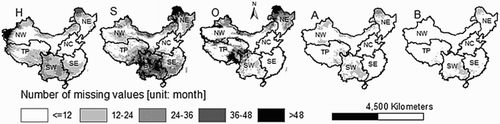
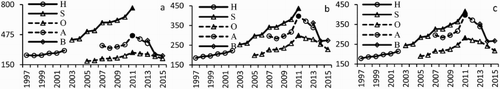
Figure 8. Comparison of temporal series of the annual TNC calculated under different grid-selection rule: (a), grids with less than 12-month missing values are selected, (b), grids are selected by the rule described in Section 2.2 and (c) all grids are included. The solid mark represents the highest level of annual TNC. Unit: 1015 molecules cm−2. GOME/ERS-2 (H), SCIAMACHY (S), OMI (O), GOME-2/METOP_A (A) and GOME-2/METOP_B (B).