Figures & data
Figure 1. Location of Han-Wei capital city in Luoyang, China as highlighted by the red rectangle on the left (courtesy of Google Earth) and illustrated by the Chinese GF-1 false color image on the right. GF-1 image was provided by China Centre For Resources Satellite Data and Application.
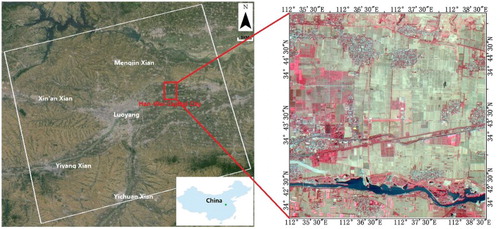
Table 1. Revisit-cycle of Cosmo-SkyMed data acquired in the ascending orbit with HH polarization and an incidence angle of 19.95°.
Figure 2. Scattering mechanism of the wheat.
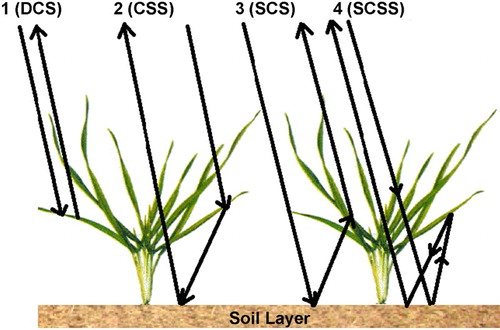
Figure 3. Satellite GF-1 false color image with a spatial resolution of 8 m acquired on 28 September, 2013. The circles and elliptical shapes include Ch and NCh ROIs, yellow and green colored, respectively. GF-1 image was provided by China Centre For Resources Satellite Data and Application.
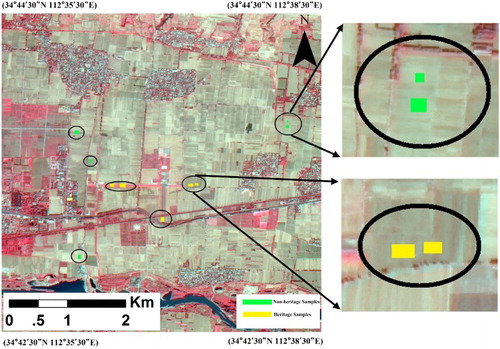
Figure 4. Flow chart of methodological approach.
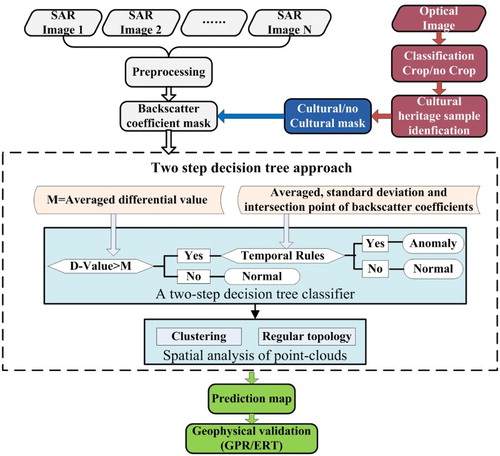
Figure 5. Backscatter coefficients of Ch (highlighted by the dotted line with triangle nodes) and NCh (highlighted by the dotted line with square nodes) samples, and their corresponding differential values (highlighted by the solid line with circle nodes). R&S (R: Raining, S: Sunny) indicate the weather condition of SAR data acquisitions with precipitations marked by blue bars.
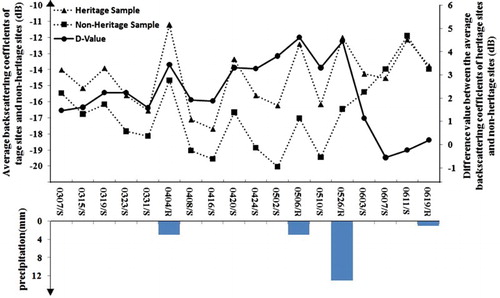
Figure 6. (a) Histograms of Ch and NCh samples in seven optimally selected acquisitions with notations of averaged, standard deviation and intersection point of backscatter coefficients. (b) Diagram for the Ch classification.
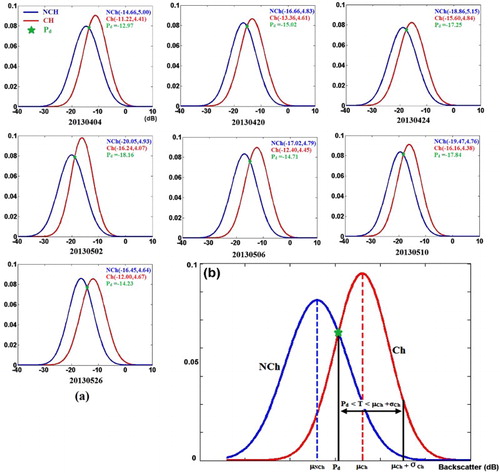
Figure 7. Prediction of archeological maps overlapped on the Cosmo-SkyMed SAR image, (a) initial result by applying the two-step decision-tree approach, (b) fine mapping considering the spatial distribution and topology of point-clouds extracted. Cosmo-SkyMed data were provided by the Italian Space Agency, under license agreement from Archeocosmo.
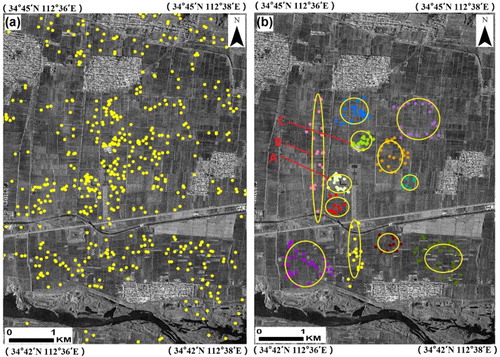
Figure 8. Validation of the temporal crop marks on SAR images. In (a) lines 1–4 indicate GPR and electrical measurements conducted in sub-region A; (b) refers to sub-region B, where two electrical (1 and 4) and four GPR (1–4) profiles have been performed, (c) refers to sub-area C, where ongoing excavation surveyed during the field campaign in 2015 revealed the presence of ancient relics, thus confirming the archeological interest of this area and validating the SAR data-processing approach.
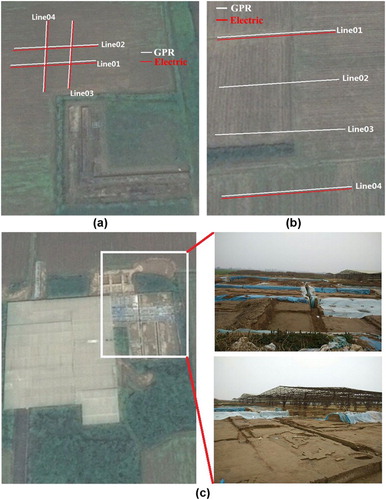
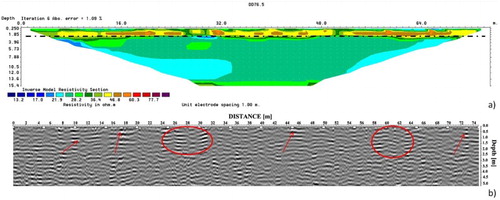
Figure 9. ERT (upper panel) and GPR (lower panel) measurements on profile line 4, sub-zone ‘A’. ERT data were acquired in Dipole–Dipole configuration and inverted with RES2Dinv (Loke Citation2001). GPR data were processed with REFLEX-W (Sandmeier Citation2006). The black dashed line in panel (a) indicates the anthropic layer. Red arrows in panel (b) point to the localized high-amplitude EM reflection possibly linked to archeological buried remains.
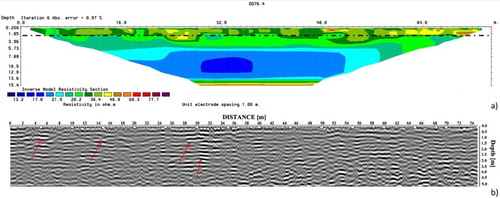
Figure 10. ERT (upper panel) and GPR (lower panel) measurements on profile line 4, sub-zone ‘B’. ERT data were acquired in Dipole–Dipole configuration and inverted with RES2Dinv (Loke Citation2001). GPR data were processed with REFLEX-W (Sandmeier Citation2006). The black dashed line in panel (a) indicates the anthropic layer. Red arrows and circles in panel (b) highlight areas with high-amplitude EM reflection possibly linked to archeological buried remains.