Figures & data
Figure 1. Example of pre-processing steps necessary for the representation of 2D data sets in 3D space.
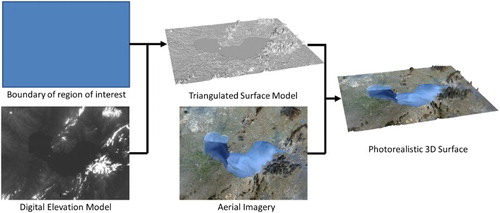
Figure 2. (a) Combining monitoring and modelling data in the context of a virtual geographic environment. (b) Schematic of a continuous workflow concept (Kolditz et al. Citation2012b).
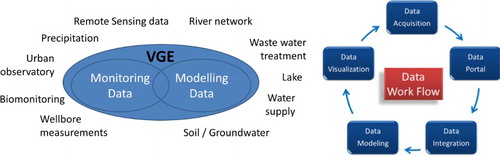
Figure 3. Supported file formats for the OGS framework. Due to the wide range of supported formats, interfacing with other simulation software is simple if an established format is supported. For instance, due to support of the netcdf format, the integration of data from models such as the WRF model used for climate simulations or the GETM used for studies of lakes or coastal regions becomes straightforward.
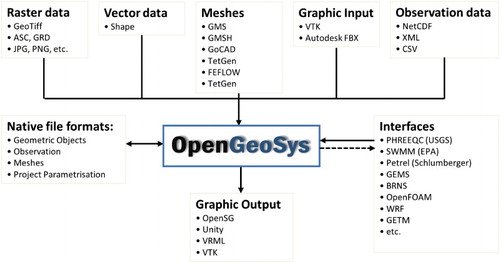
Figure 4. Visualisation of the rappbode reservoir in Germany in the context of a VGE, displayed on the video wall in a virtual reality environment.
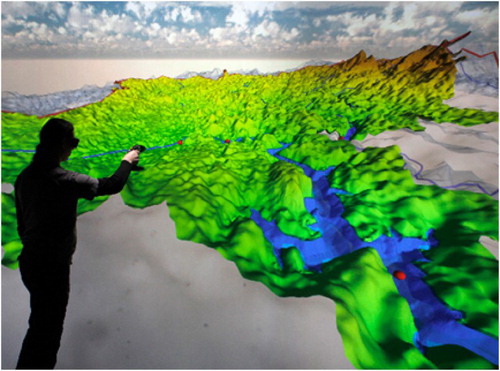
Figure 5. Visualisation of the Chao Lake VGE. (a) Super-elevated terrain of Chaohu city from the north with aerial image texture. Buoys within the lake are marked in Orange. (b) View of Chaohu city from the east with sewage network superimposed on the surface. Note the fine resolution of the texture within the city compared to the rougher texture in the background (c) Super-elevated view of Chao Lake from the southwest. Mapped on the lake surface is a LANDSAT 8 image showing algal bloom in summer. (d) view of land use information in the Chao Lake region. Chaohu city is located in the lower left corner, road- and river network are mapped onto the terrain surface.
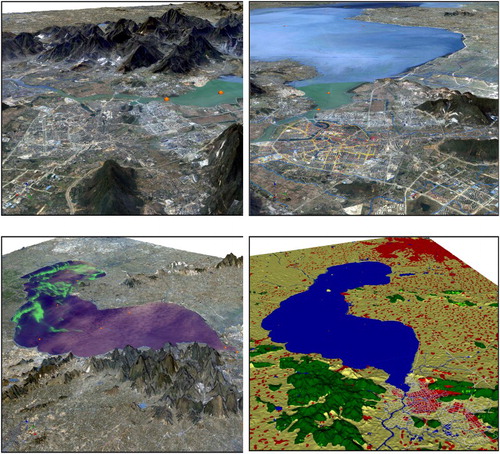
Figure 6. Visualisation of one time step of simulated ammonium-concentration in a river network. The simulation results have been created using the SWMM (Rossman Citation2014). SWMM output has then been imported into OGS data structures for visualisation (SWMM data provided by Michael Käseberg).
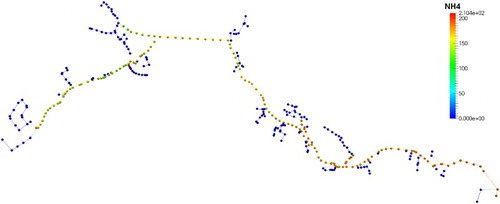
Figure 7. Embedded simulation of Chao Lake into 3D geographical scene. To enhance the existing topography of the region, the underlying DEM has been super-elevated by factor 5 and texturised using an aerial image of the region. With a maximum depth of 5 metres, Chao Lake is extremely shallow for a lake of its size. The depicted bathymetry has been super-elevated by factor 200 to give a sense of its 3D surface. Mapped on the lake surface is the result of preliminary simulation of evapotranspiration using the GETM (Burchard and Bolding Citation2002).
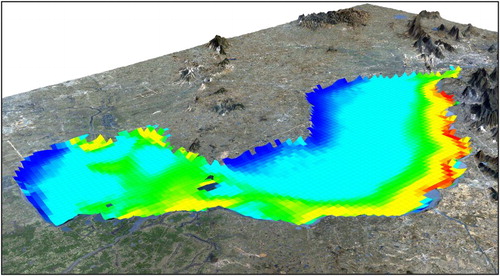
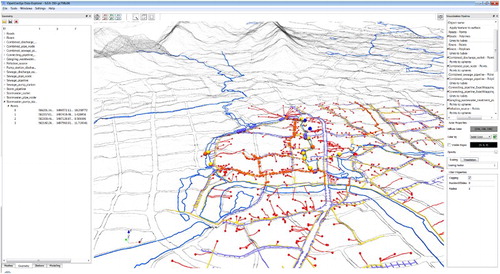
Figure 8. Pre-processing of data sets. Depicted is the OGS Data Explorer interface while integrating the drainage pipeline system in Chaohu city into the existing scene. The terrain surface mesh is semi-transparent visible in the background for reference as well as the road- (grey) and river network (blue). Fifteen data sets related to the drainage system have been loaded, mapped and assigned colours according to their function (e.g. violet data represents storm pipeline infrastructure, yellow signifies sewage infrastructure, etc.).