Figures & data
Figure 1. Through the simple and friendly use of GLOBELAND30, statistics of changes between 2000 and 2010 can be obtained by any area of the world. In this example, the Mexican State of Chiapas.
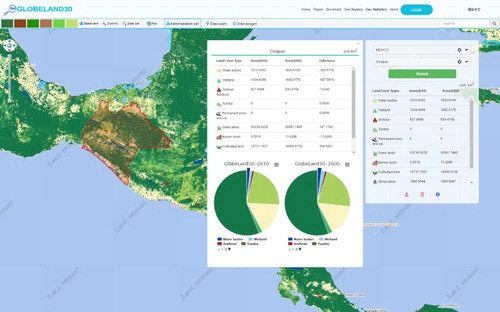
Figure 2. A time series display showing three parallel time-series: prices of a quarter of wheat (the histogram bars), wages of a good mechanic (the line beneath it) and the reigns of English monarchs from Elizabeth I to George IV (1565 through 1820). © http://www.lindahall.org/william-playfair/ - Scientist of the Day - William Playfair - September 22, 2015 - Dr. William B. Ashworth, Jr., Consultant for the History of Science, Linda Hall Library and Associate Professor, Department of History, University of Missouri-Kansas City.
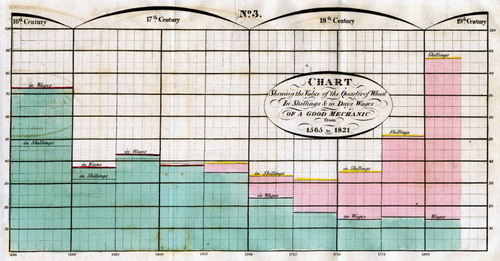
Figure 3. An innovative and interactive technology to display layers in 3D. Most of the data sets in the Science On a Sphere® catalog were created by NOAA and NASA and are freely available for public use. Others have been created by science museums, universities, and other individuals. The Magic Planet © NASA Jet Propulsion Laboratory.
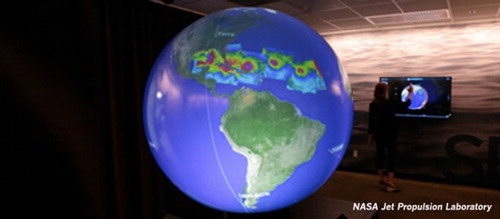
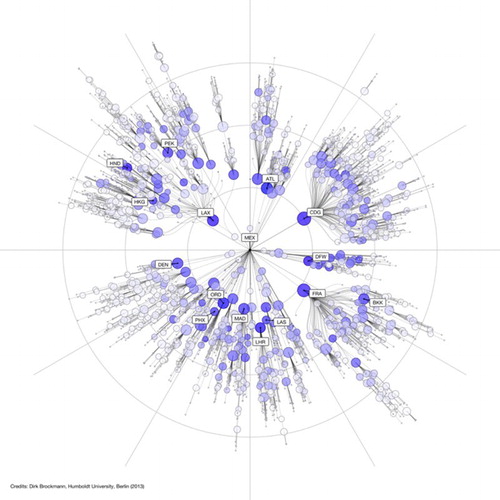
Figure 4. The Global Trachoma Mapping Project, http://www.scidev.net/global/disease/data-visualisation/trachoma-mapping-project.html) (Brockmann and Helbing Citation2013).