Figures & data
Figure 1. The variability of short-wave (red line), long-wave (blue line) and net (black line) radiation fluxes for September (a), October (b) and November (c).
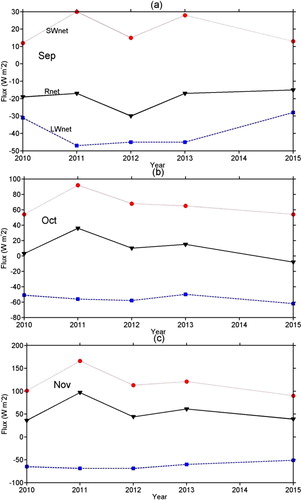
Figure 2. The short-wave (a), (b) and long-wave (c), (d) radiation fluxes anomalies regressed on the austral spring Niño 3.4 (a), (c) and AAO (b), (d) indices. The filled regions are significant at the 95% confidence level. The red asterisk indicates the location of the radiation observation site.
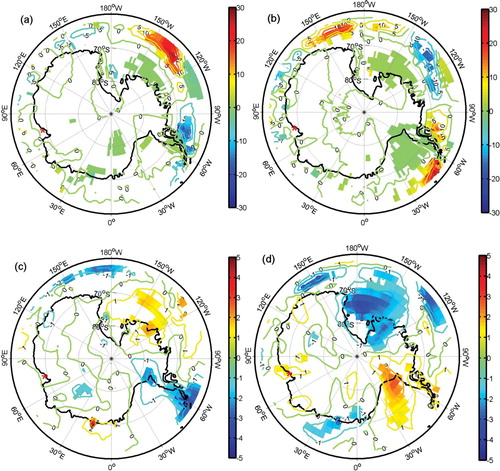
Figure 3. The five-year averaged time series of downward short-wave (a), upward short-wave (b), downward long-wave (c), upward long-wave (d), net (e) radiation fluxes, (f) albedo, (g) surface temperature and (h) snow thickness in austral spring.
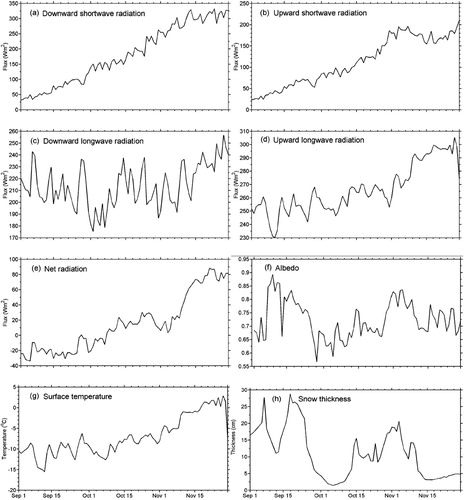
Figure 4. The five-year averaged diurnal cycles of downward/upward short-wave (a), downward/upward long-wave (b), net (c) radiation fluxes, (d) surface temperature and (e) albedo in austral spring.
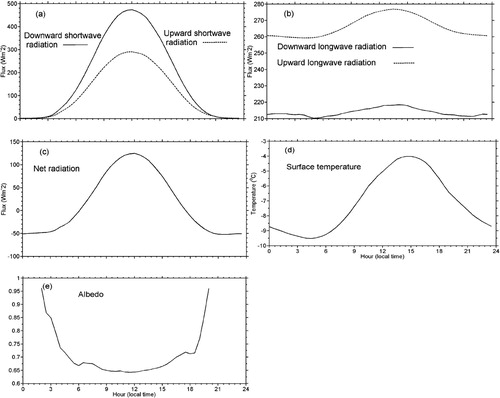
Figure 5. The sea ice thickness (a) and its average growth rate (b) in five austral springs: 2010 (black), 2011 (red), 2012 (green), 2013 (yellow) and 2015 (magenta).
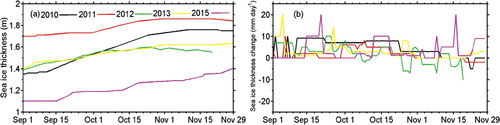
Figure 6. The surface temperature change for five austral springs: 2010 (black), 2011 (red), 2012 (green), 2013 (yellow) and 2015 (magenta).
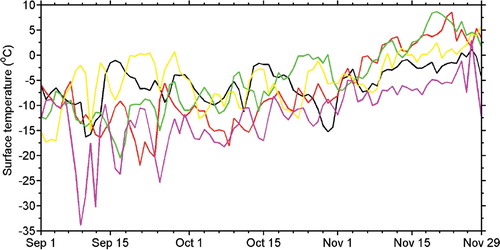
Figure 7. Wavelet spectra for the downward short-wave (a), upward short-wave (b), downward long-wave (c), upward long-wave (d), and net (e) radiation fluxes from 1 September to 29 November 2010.
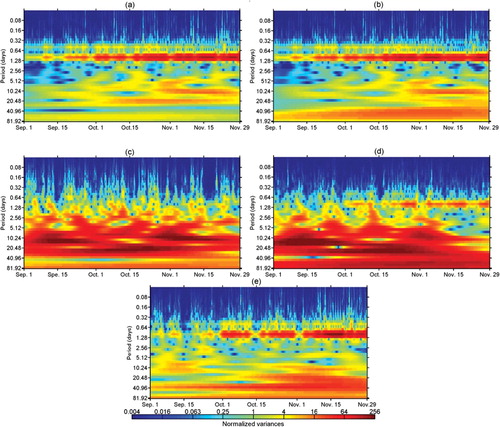
Figure 8. The fourth IMF of the time series of downward short-wave radiation for five springs.
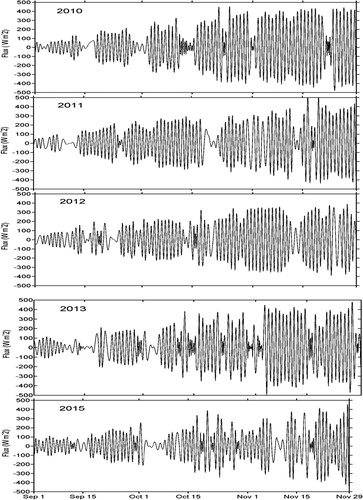
Table 1. Springtime changes in the amplitude of daily cycles of surface radiation fluxes for five years (units: W m−2 day−1).
Figure 9. The EMD averaged diurnal cycle of the downward short-wave (a), upward short-wave (b), upward long-wave (c) and net (d) radiation in austral spring.
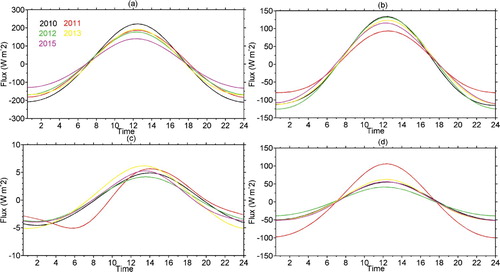
Figure 10. The time series of downward long-wave radiation on the synoptic time scale for five austral springs.
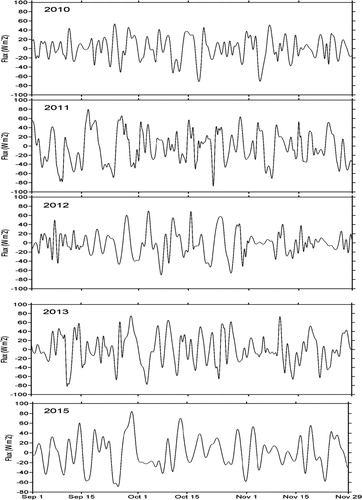
Table 2. Mean standard variances of downward and upward long-wave radiation on the synoptic and intraseasonal time scales (units: W m−2).
Figure 11. Observed time series of atmospheric variables at Zhongshan station from 22 September to 29 September 2015.
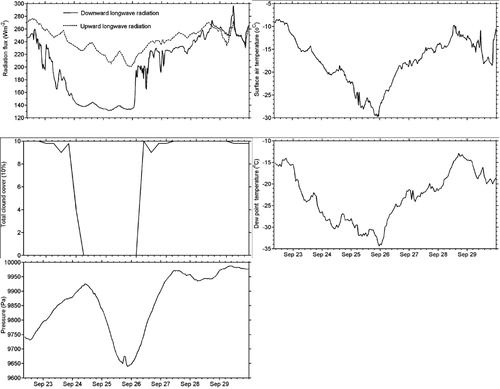
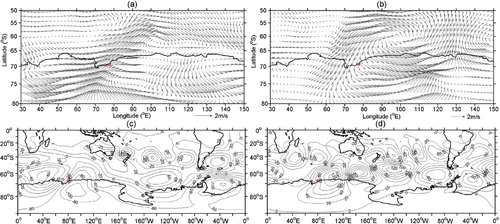
Figure 12. Surface wind field over east Antarctic on 22 September 2015 (a), 25 September 2015 (b) and 27 September 2015 (c). ‘C’ indicates a polar cyclone. The red asterisk indicates the observation site.
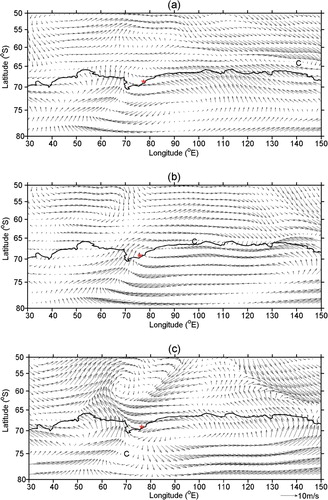
Figure 13. The time series of downward long-wave radiation on the intraseasonal time scale for five austral springs.
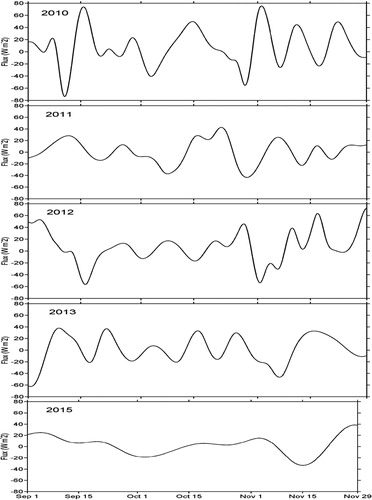
Figure 14. Time series of 10–90 day filtered atmospheric variables at Zhongshan station for 27 October to 30 November 2013. The seasonal cycle is removed.
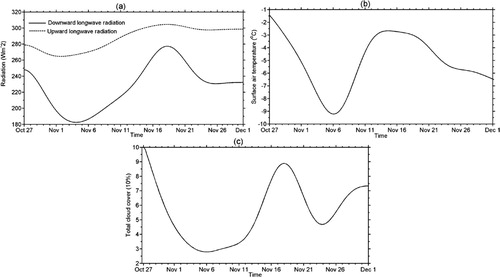
Figure 15. 10–90 day filtered mean surface wind field (a), (b) and 500-hPa geopotential height (c), (d) in east Antarctic for 1 to 8 November (a), (c) and 15 to 21 November 2013 (b), (d).