Figures & data
Figure 1. Examples of TOA true color images acquired by sentinel-2A/MSI (left) and Landsat-8/OLI (right): (A) tile 20HNH over Argentina, dates of Sentinel-2A/MSI and Landsat-8/OLI acquisitions are 2015358 and 2015361 respectively; (B) tile 20HPH over Argentina, acquisitions dates are 2015358 and 2015258; (C) tile 14SKF over Texas, U.S.A., dates of acquisitions are 2016012 and 2016104; (D) tile T36UUU over Ukraine, acquisition dates are 2016169 and 2016108; (E) tile T34UFU over the Carpathian Mountains, Ukraine, acquisitions dates are 2016198 and 2016063.
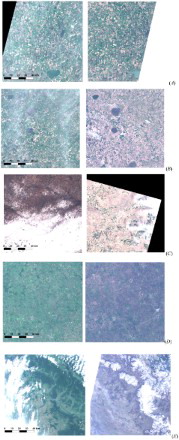
Table 1. Description of data used in the study.
Figure 2. General workflow of Landsat-8 and Sentinel-2A image co-registration.
Figure 3. Location of CPs shown in the form of vectors outlining the direction and magnitude of shifts ( and
(Equation (2)) found between Landsat-8 image acquired on 2016021 (21-Jan-2016), and Sentinel-2A image acquired on 2015358 (24-Dec-2015) and used as a reference image, over the study area in Argentina, tile T20HNH. Vector lengths were multiplied by 100 for visual clarity. Overall, 1634 CPs were found using the phase-correlation approach in this case. The background is a Landsat-8 TOA NIR (band 5) image with TOA reflectance values scaled from 0.05 to 0.65.
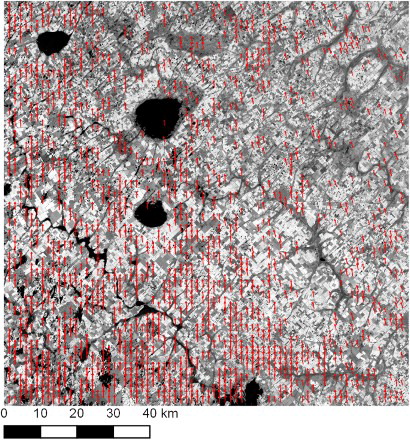
Figure 4. Distribution of misregistration values and
(Equation (2)) when co-registering Landsat-8 to Sentinel-2A images for different tiles used in the study. Units are shown in pixel values at 30 m spatial resolution.
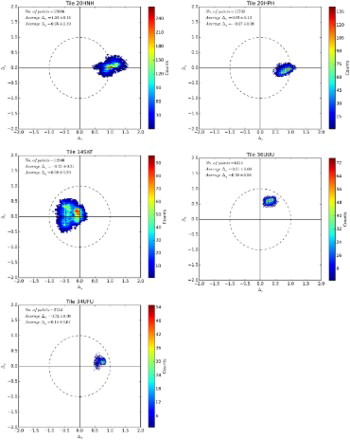
Table 2. Results of identifying CPs on the sensed (Landsat-8) and reference (Sentinel-2A) images using phase-correlation approach at 30 m spatial resolution.
Figure 5. Distribution of misregistration values and
when co-registering multi-temporal Sentinel-2A images from the same orbits for different tiles used in the study. Units are shown in pixel values at 10 m spatial resolution.
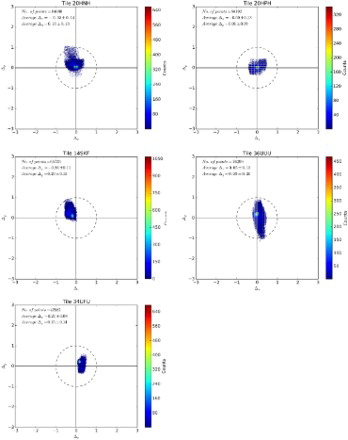
Figure 6. Distribution of misregistration values and
when co-registering multi-temporal Sentinel-2A images from the adjacent orbits for different tiles used in the study. Units are shown in pixel values at 10 m spatial resolution.
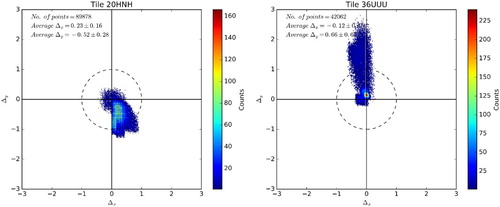
Table 3. Results of identifying CPs on the sensed (Sentinel-2A) and reference (Sentinel-2A) images using phase-correlation approach at 10 m spatial resolution.
Table 4. Average and standard deviation of the RMSE error (Equation (4)) calculated for different transformation functions using CPs from testing set when co-registering Landsat-8 and Sentinel-2A images.
Table 5. Average and standard deviation of the RMSE error (Equation (4)) calculated for different transformation functions using CPs from testing set when co-registering multi-temporal Sentinel-2A images from the same orbit.
Table 6. The same as , but for adjacent Sentinel-2A orbits.
Figure 7. Changes of RMSE error of building a 1st degree polynomial transformation function when registering multi-temporal Sentinel-2A images over the time for different tiles and different Sentinel-2A orbits: (A) same orbits; (B) adjacent orbits.
Figure 8. A 30 m ‘chessboard’ composed of alternating Landsat-8 (acquired on 20-Dec-2015) and Sentinel-2A (24-Dec-2015) images before (left panel) and after co-registration (right panel). Near-infrared images from band 5 (Landsat-8) and band 8 (Sentinel-2A) were used to produce these ‘chessboard’. TOA reflectance values were scaled from 0.05 to 0.55. This subset covers the area in the south-east part of the tile 20HNH over Argentina ((A)). Misregistrations between satellite images can be seen in the irrigated fields (circles, middle left image) and in the bridge over the lake (bottom left image) with corrections applied and misregistration disappearing in the right images (middle and bottom). Middle and bottom subset images are shown in corresponding boxes on the top images.