Figures & data
Figure 1. Urban land patterns in BAMR area (housing). Left: urban centers of provincial departments; Middle: slums or informal settlements; Right: disperse housing. Modified from ‘Natural territory, urban growth and climate change in the Parana River Delta and Rio de la Plata estuarine system, Verónica M.E. Zagare, 2011’.
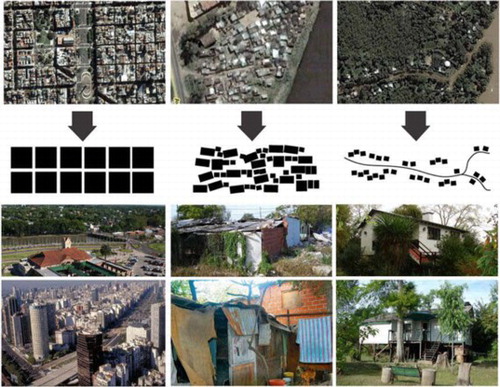
Figure 2. Other urban land features in BAMR area. (A) Amusement parks (Parque de la Costa). (B) Parking lots. (C) Roads and bridges. (D) Airports (Ezeiza International Airpor). Pictures acquired from google earth.
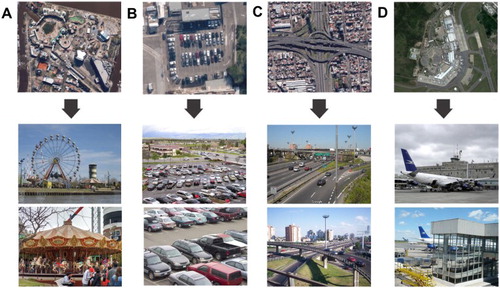
Figure 3. Location of BAMR. Left box: Buenos Aires Province. Right dashed box: Buenos Aires Metropolitan Region (BAMR).
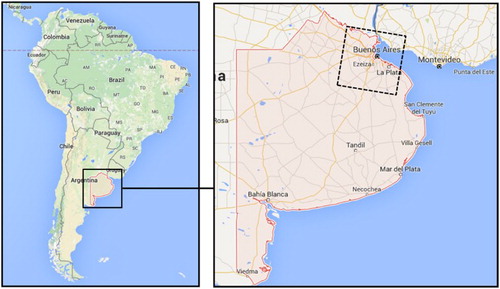
Figure 4. Decision tree analysis. (A) Classify the BAMR region into urban and non-urban land. (B) Use bands from both images to classify cropland loss.
Table 1. Urban and non-urban area statistics (Calculated with Landsat image footprint).
Figure 5. Urban land expansion in BAMR. (A) Urban land classification of Landsat image (path 225 row 084, BAMR) for June 1985 from USGS Glovis. (B) Urban land classification of Landsat image (path 225 row 084, BAMR) for July 2015 from USGS Glovis. (C) (A) merged with 5B. Yellow: 1985 urban land; Green: 2015 urban land. (D) Lisandro Olmos (dashed box) is a newly urbanized area in BAMR. (E) Google Map image showing the boundary of Lisandro Olmos. (F) Google Earth satellite image showing the urban extent of Lisandro Olmos in July 2015. (Color online.)
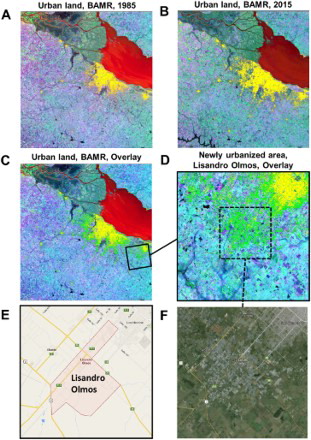
Figure 6. Cropland loss in BAMR. (A) Cropland loss shown on 1985 Landsat image of BAMR. (B) Cropland loss shown on 2015 Landsat image of BAMR. (C) Cropland loss classification analysis. Yellow: lost area of cropland; Blue: non-change area of cropland. (D) Probability map of cropland loss results. Black: 0%; Blue: 50%; Green: 100%. (Color online.)
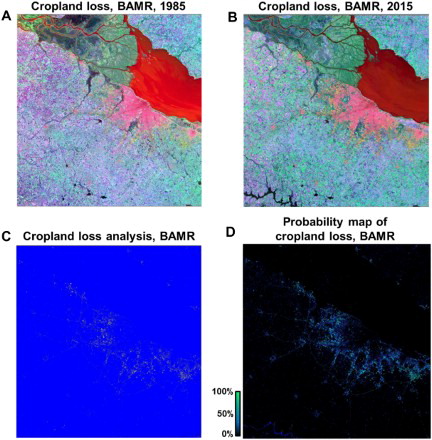
Figure 7. Comparison of cropland loss due to urbanization between different cities. (A) Cropland loss during urban expansion from 1985 to 2015 in BAMR, Argentina. (B) Cropland loss during urban expansion from 1999 to 2005 in Shenzhen, China. (C) Cropland loss during urban expansion from 1950 to 2010 in USA.
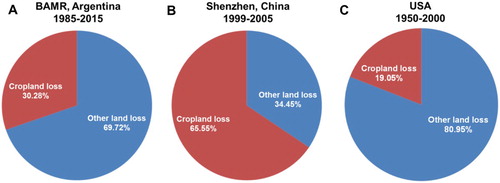
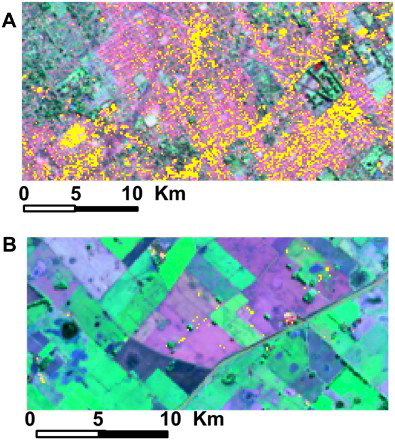
Figure 8. Limitations in detecting land cover changes. Rio Salado (Salty River) is a river that crosses several provinces of Argentina and its flow is regulated by the Los Figueroa Reservoir, and by a Derivation Dam (Dique Derivador). (A) Rio Salado dried out in June 1985. (B) Rio Salado formed a wide river in July 2015.
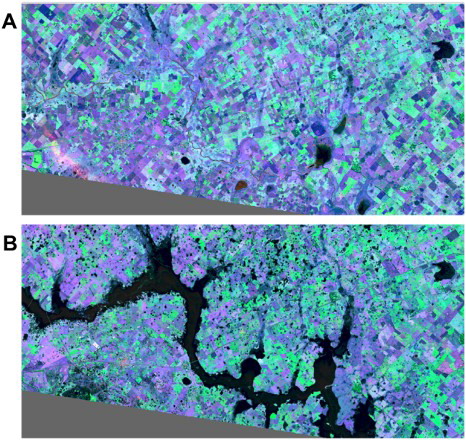
Figure 9. Potential errors in detecting land cover changes. (A) Omission error where urban lands were under-classified. (B) Commission errors where cropland were identified as urban land.