Figures & data
Figure 1. Map of the reservoir system Bever-Block, managed by the Wupperverband. The four water bodies are interlinked through a transition system.
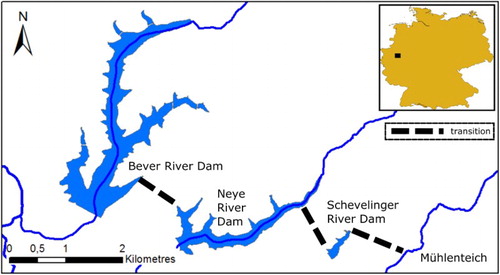
Figure 2. Overview of the TaMIS Geoprocessing Architecture.
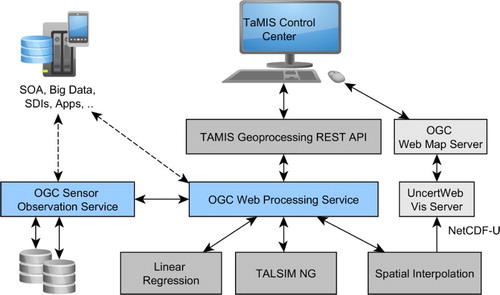
Figure 3. Options for Coupling OGC SOS and WPS. (a) Loose-coupling, (b) tight-coupling, and (c) one-component.
Figure 4. Illustration of the TaMIS process profiles implemented using multiple linear regression. (a) WPS Process fill-series, (b) WPS Process predict series, and (c) WPS Process predict single value.
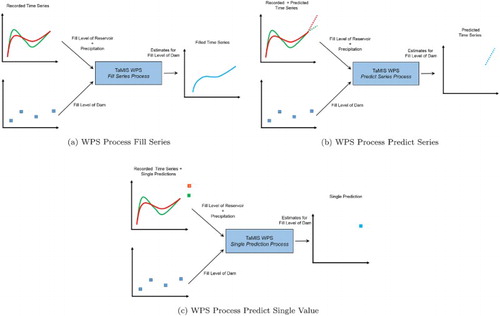
Figure 5. UML diagram of the process model for the Geoprocessing REST API.
Listing 1. Process description encoded in JSON (Note: Some elements have been removed in the JSON examples for better readability)
Listing 2. Job resource encoded in JSON with input and output definition that needs to be posted to the API to create a new job.
Listing 3. Representation of a running Job encoded in JSON
Listing 4. Representation of a Job that is finished encoded in JSON
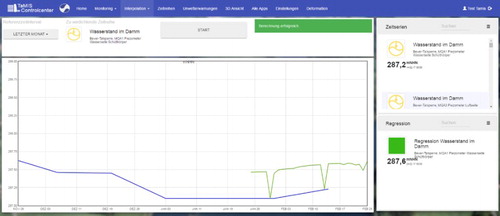
Figure 6. Screenshot of the TaMIS Control Center landing page. The different WPS processes can be selected in the navigation bar in Alle Apps at the top.
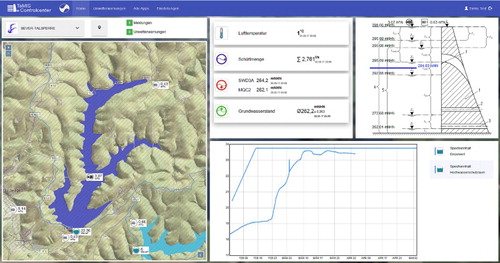
Figure 7. User interface for executing the fill level prediction.