Figures & data
Figure 1. Conceptual view of a model-driven analysis. General features are extracted and stored in a database as index of the EO data (1). A user-defined high-level model of a lake contextualises the features in the information layer. The system decodes and translates the high-level model into a low-level query (2) and executes it against the database (3).
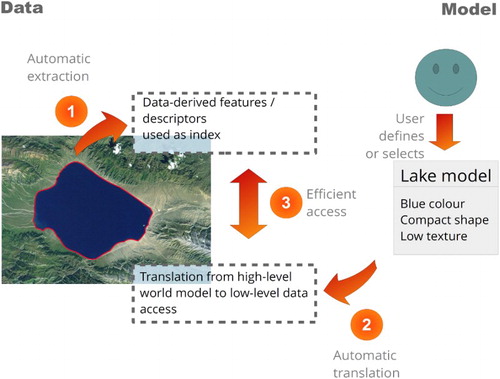
Figure 2. Example of a prosaic query protocol in the web application for creating world models to facilitate semantic online geoprocessing of EO data.
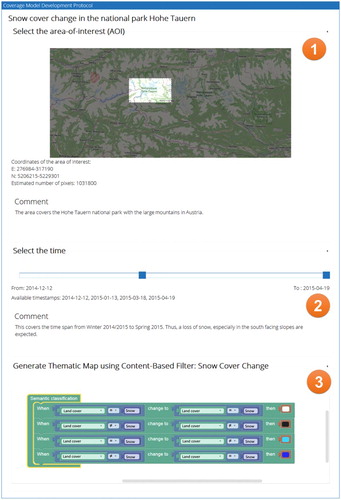
Figure 3. Advanced graphical search in the knowledge base with several sorting and filtering capabilities.
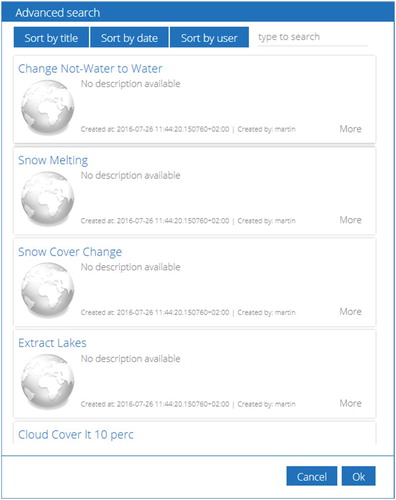
Figure 4. Interplay of components and integration of the OGC WPS as enabler for syntactic interoperability for large-scale online EO image processing.
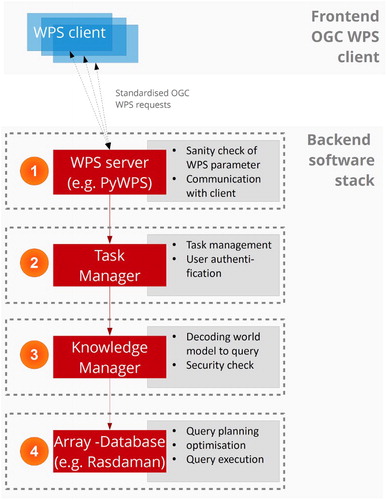
Figure 5. A thematic map showing areas (blue) in the northern part of Somalia, which were flooded at least once in the time between January and September 2016. The information product was generated automatically and online using all available Landsat 8 images of that area in the given time span. The basemap is copyrighted by OpenStreetMap contributors and available from https://www.openstreetmap.org/.
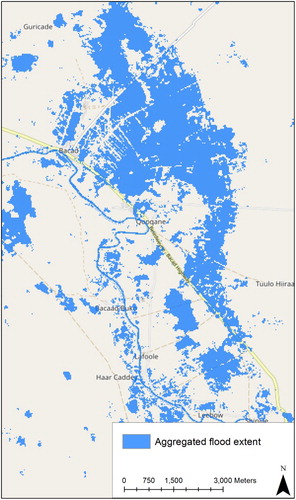
Figure 6. Graphical representation of an example world model that condenses a condition (‘turbid water or deep water’) over time using ‘OR. ‘OR’ generates a binary mask where are all areas where this condition is true at least once are labelled with 1, otherwise with 0.
Figure 7. Graphical representation of an example world model that classifies changes in land use classes.
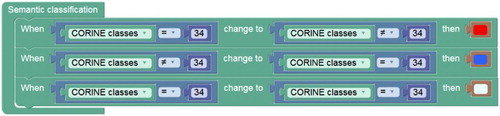
Figure 8. A thematic map showing glacier developments in the Hohe Tauern national park. The information product was generated automatically and online using CLC/land use classes. The basemap is copyrighted by OpenStreetMap contributors and available from https://www.openstreetmap.org/.
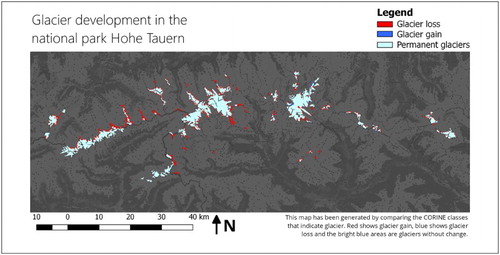
Figure 9. Detail view of a comparison between the extracted results and the official CORINE change layer with black outline. The basemap is copyrighted by OpenStreetMap contributors and available from https://www.openstreetmap.org/.
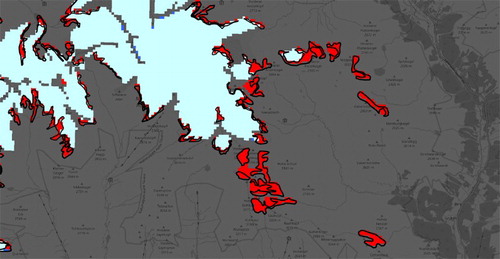
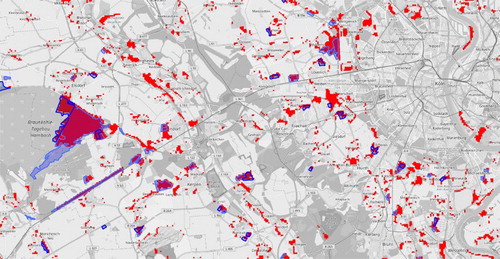
Figure 10. A thematic map showing urbanisation processes around Cologne (Germany). The information product was generated with the same physical dataset than but applying a different world model. The basemap is copyrighted by OpenStreetMap contributors and available from https://www.openstreetmap.org/.
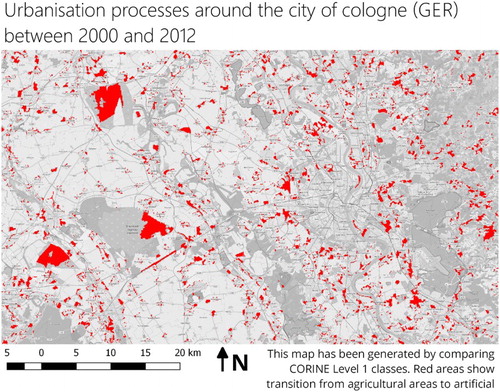
Figure 11. Detail view of a comparison of extracted features from the remote dataset and the official CORINE change layer (blue areas). The basemap is copyrighted by OpenStreetMap contributors and available from https://www.openstreetmap.org/.