Figures & data
Figure 1. The (a) geographical location, (b) local topography and (c) the observation tower of Zhongshan station.
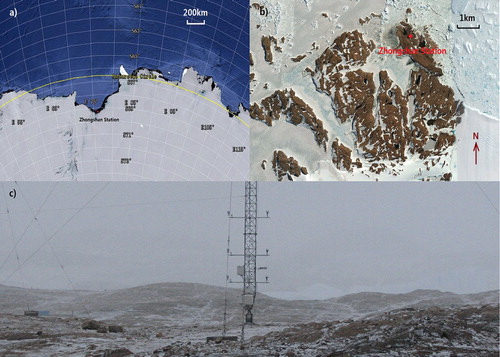
Table 1. The type of sensors and their key technical indexes.
Figure 2. Seasonal averaged diurnal variation of (a) wind speed at 3.9 m height, (b) wind direction at 3.9 m height, (c) air temperature at 3.9 m height (solid lines) and radiative temperature of surface (dashed lines), (d) humidity at 3.9 m height collected at the Zhongshan station tower from March 2008 to February 2009.
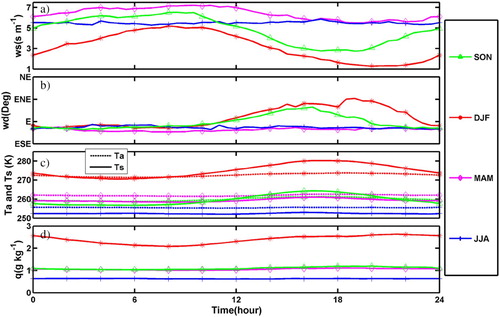
Figure 3. The seasonal averaged diurnal variation of (a) DSR, (b) USR, (c) DLR, (d) ULR and (e) Rn during the period from March 2008 to February 2009 at Zhongshan station.
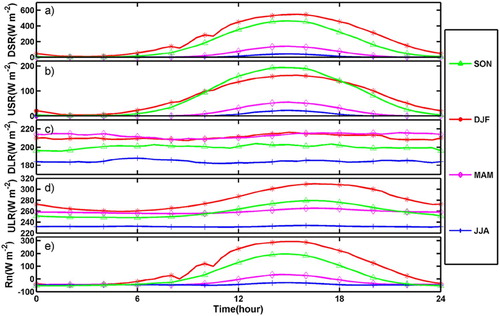
Figure 4. The seasonal averaged diurnal variation of (a) momentum flux (τ), (b) sensible heat flux (SH) and (c) latent heat flux (LE) during the period from March 2008 to February 2009 at Zhongshan station.
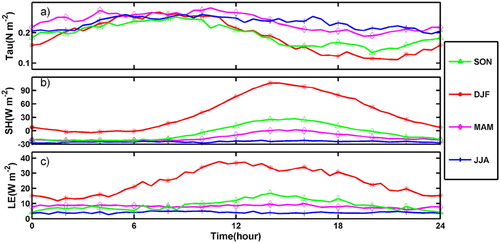
Figure 5. The monthly averaged (a) net radiation flux (Rn), sensible heat flux (SH), latent heat flux (LE) and soil heat flux (G), (b) precipitation, evaporation (or sublimation) and their difference (precipitation minus evaporation) during the period from March 2008 to February 2009 at Zhongshan station.
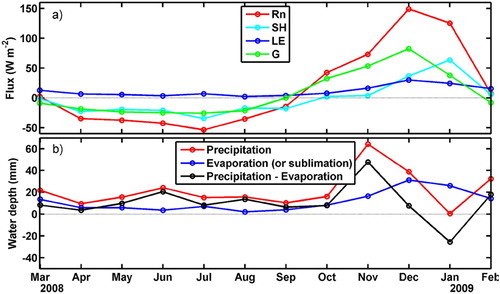
Figure 6. The calculated log(z/z0m) versus wind speed (blue dots), its 0.5 m s−1 bin averaged values (red dots), the partially linear regression (black dashed line) and the overall averaged value (black solid line).
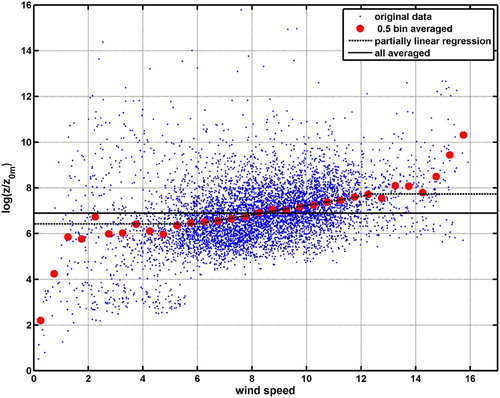
Table 2. The regression slope between u*cal and u*ec, and the bias and standard error of u*cal from u*ec, for the two methods of z0m deduction.
Figure 7. The calculated log(z0h/z0m) versus log(Re∗). The dots are the bin averaged log(z0h/z0m) with 0.1 interval of log(Re∗). Observation sample numbers for each stratification condition are shown in the bottom part. Black, red and blue colors represent for neutral, unstable and stable condition, respectively. Red circles indicate that the observation sample number in the bin are larger than 100. A87, S08, Z95, Z97 and a whole averaged z0h are also shown as black solid, black dashed, green solid, green dashed and cyan solid lines.
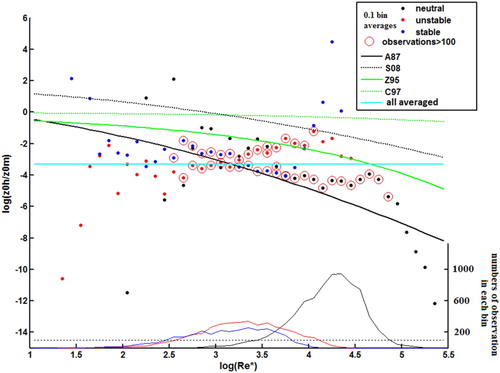
Figure 8. The calculated θ* with (a) A87, (b) S08, (c) Z95, (d) C97 and (e) the constant value of 1.2 × 10⁻⁴ and 10-min averaged wind and temperature observations at 3.7 m height. Blue dots are the original data, and red dots are the 0.05 bin averaged values.
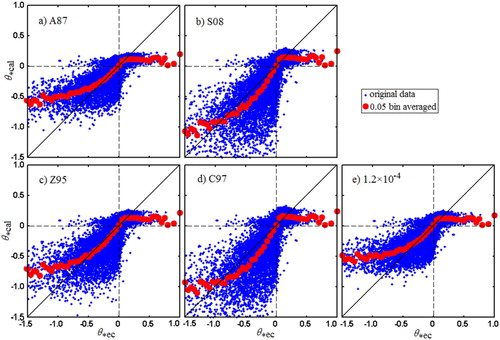
Table 3. The regression slope between θ*cal and θ*ec when −0.5 ≤ θ*ec ≤ 0.2, and the bias and standard error of θ*cal from θ*ec, for the five methods of z0h deduction.
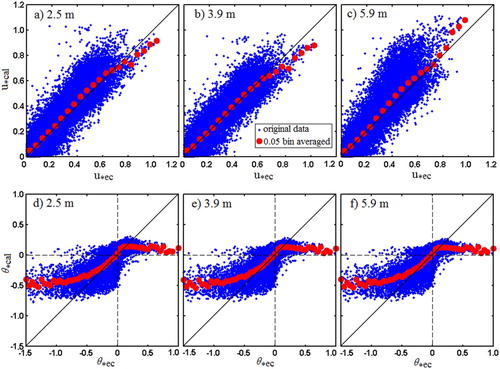
Figure 9. The calculated u* (upper panels) and θ* (lower panels) with z0m = 3.6 × 10⁻³ m and z0h = 1.2 × 10⁻⁴ m and 10-min averaged wind and temperature observations at 2.5, 3.9, and 5.9m height. Blue dots are the original data, and red dots are the 0.05 bin averaged values.