Figures & data
Figure 1. The geolocation of the last chance and sugar pine study areas and the distribution of 17 selected study sites and 61 field-measured plots.
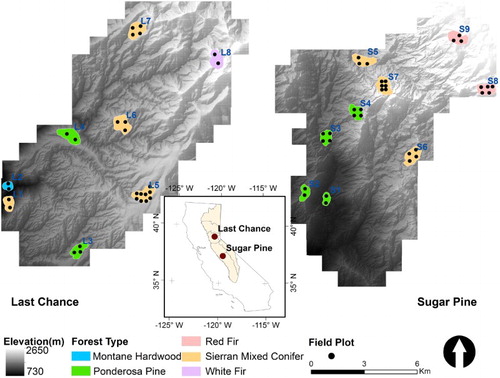
Figure 2. Flowchart of the methodology. ΔH, ΔA, and ΔV mean tree height, crown area, and crown volume.
Figure 3. An example of tree crown segmentation results and the corresponding tree top locations. TPt1/2 are tree tops and TCt1/2 are tree crowns detected from ALS1/2, respectively.
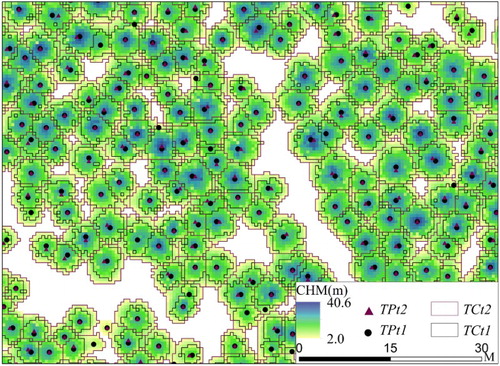
Figure 4. A schematic figure showing manual editing on tree pairing under three scenarios: (a) the crown area of the dominant tree increased from ALS1 to ALS2; (b) the crown area of the dominant tree decreased from ALS1 to ALS2; and (c) tree crowns were mis-segmented in ALS2. TPt1/2 are tree tops and TCt1/2 are tree crowns detected from ALS1/2, respectively.
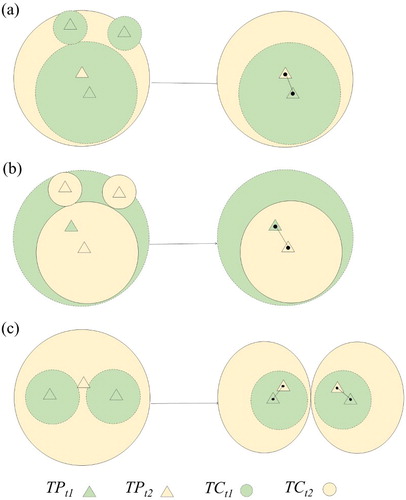
Figure 5. Distributions of tree height, crown area, and crown volume at (a) Last Chance and (b) Sugar Pine from ALS1 and ALS2. The mean values of the changes from ALS1 to ALS2 are also labeled for each site.
Figure 6. Comparison of the cumulative proportions of tree size changes from ALS1 to ALS2 in Last Chance and Sugar Pine in five classes: sharp increase (ΔH ≥ 10 m, ΔA ≥ 20 m2, and ΔV ≥ 200 m3), median increase (1 m ≤ ΔH < 10 m, 10 m2 ≤ ΔA < 20 m2, and 50 m3 ≤ ΔV < 200 m3), minor/no increase (0 m ≤ ΔH < 1 m, 0 m2 ≤ ΔA < 10 m2, and 0 m3 ≤ ΔV < 50 m3), minor/median decrease (−10 m ≤ ΔH < 0 m, −20 m2 ≤ ΔA < 0 m2, and −200 m3 ≤ ΔV < 0 m3), and sharp decrease (ΔH < −10 m, ΔA < −20 m2, and ΔV < −200 m3).
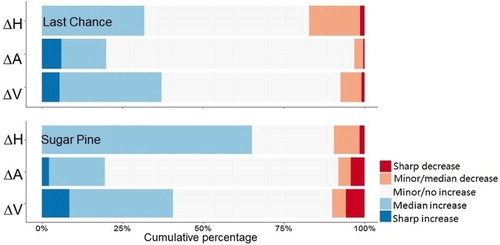
Figure 7. Comparisons of (a) tree height, (b) crown area, and (c) crown volume among 17 study sites. Black and grey bars are the mean values of tree sizes estimated from ALS1 and ALS2. Error bars show one standard deviation of tree sizes in each site.
Figure 8. Correlation coefficients between tree growth in (a) height, (b) crown area, and (c) crown volume and original tree size (H1, A1 and V1) and competition indices (CCT, CC66, CCHT, and TN).
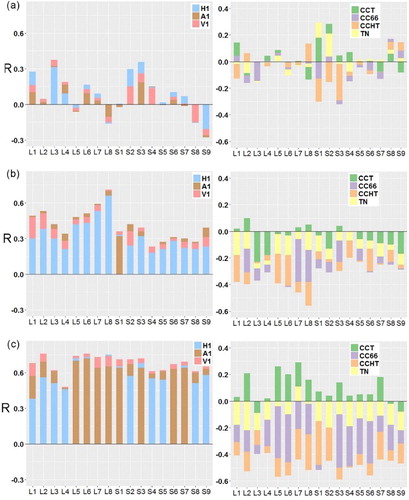
Figure 9. Scatter plots between site-level tree growth in ΔH, ΔA, ΔV and 10 factors from original tree sizes (H1, A1, and V1); forest structure indices (CC, DT, and NNI); and topographic parameters (slope, elevation, GI, and TWI). Each dot presents a site mean value and its color indicates the number of trees in each site. The regression line is presented in the black line. R is labeled as significant at the confidence level of 99.9% (***), 99% (**), and 95% (*).
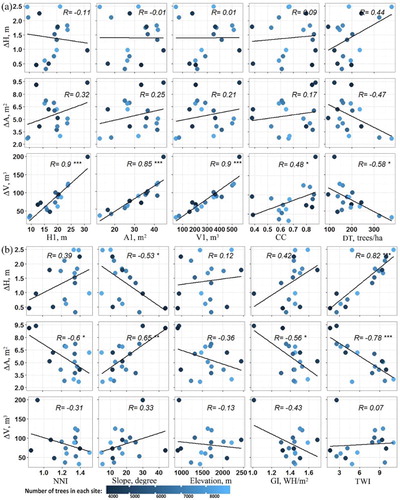
Figure 10. Comparison between ALS estimated tree height and field-measured tree height at plot level. Subfigure (a) and (b) show data collected in the first and second-time periods over 61 plots.