Figures & data
Figure 1. Study area location and the portion of EO-1 Hyperion image used in the study (date of collection 2004/10/09; spectral bands centered in 1648.0, 823.0 and 661.0 nm in the RGB composition, respectively). Inset boxes represent priority regions of study at the pixel scale.
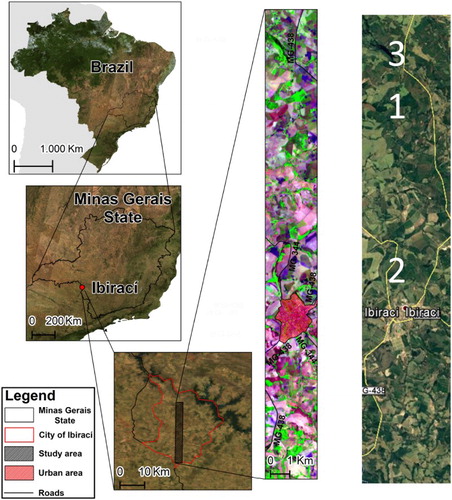
Figure 2. Independent field signatures of tropical soils and vegetation used in this study.
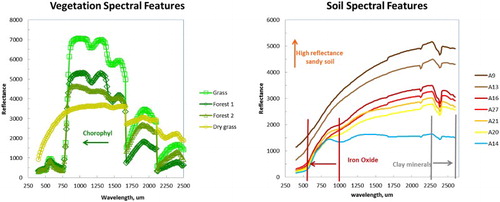
Figure 3. Flowchart for the unsupervised landscape mapping of tropical soils and vegetation.
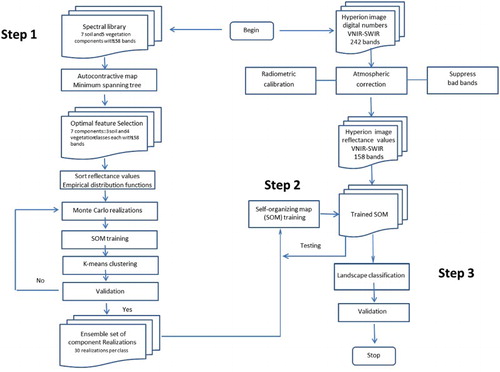
Figure 4. Autocontractive results for tropical soils and vegetation presented as distances in a minimum spanning tree.
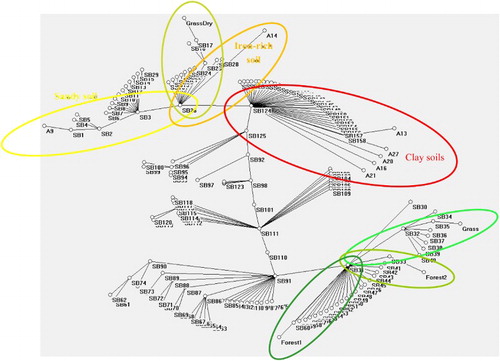
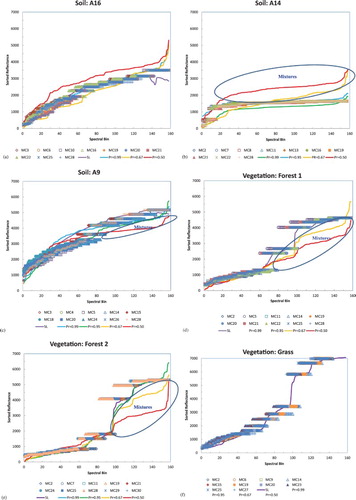
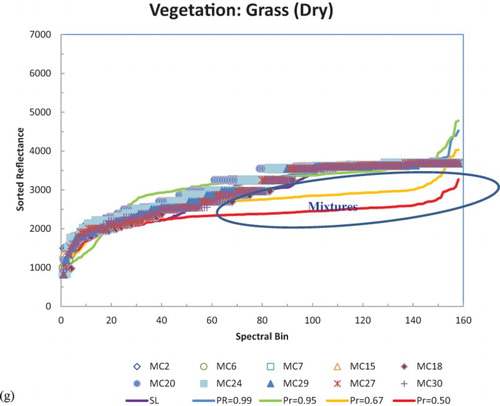
Figure 6. Clustering in the universal-distance matrix of SOM results. Individual clusters agree with the seven component types validating the stochastic SOM training process. Soil components: a) clay-rich Latosols (A16), (b) iron-rich Nitisols (A14), (c) quartz-rich Arenosols (A9); Vegetation components: (d) Forest 1 (Aspen), (e) Forest 2 (Blackbrush), (f) grass, and (g) dry grass. Individual clusters agree with the seven independent component types thereby validating the stochastic SOM training process.
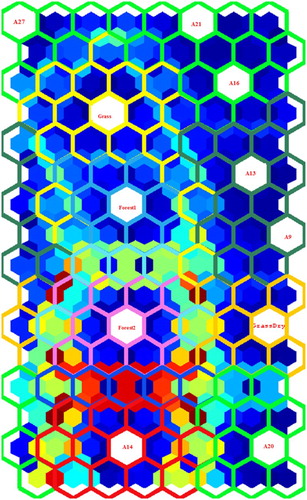
Table 1. Classification of landscape components by SOM and different network sizes.
Table 2. A summary table of classified landscape features according to prescribed pixel exceedances.
Figure 7. Classification of fractional landscape components in the Hyperion scene: (a) OE-1 Hyperion image (red, green, blue bands centered at 1648.0 nm, 823.0 nm and 661.0 nm), (b) quartz-rich Arenosols (A9), (c) iron-rich Nitisols (A14), (d) clay-rich Latosols (A16), (e) Forest1 (Aspen-like trees), (f) Forest1 (Blackberry-like trees), (g) FOREST (all), (h) GrassDry (nonphotosynthetically active), (i) Grass (photosynthetically active), (j) GRASS (all).
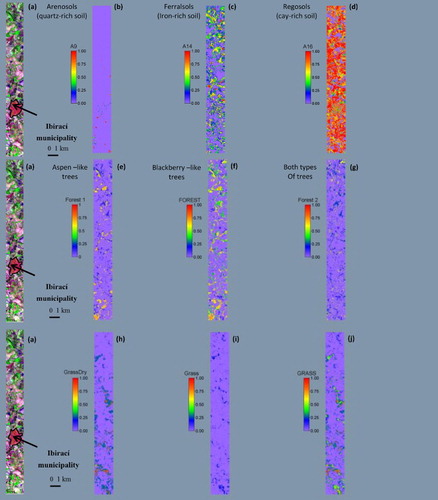
Figure 8. Field verification: (a) Location of Hyperion soil test areas (CC R650/G548/B477) and (b) crossplots of observed versus estimated Hyperion spectra for soils: (1) iron-rich Latosol, (2) vegetation, (3) clay-rich Nitosol, (4) quarts-richArenosol.
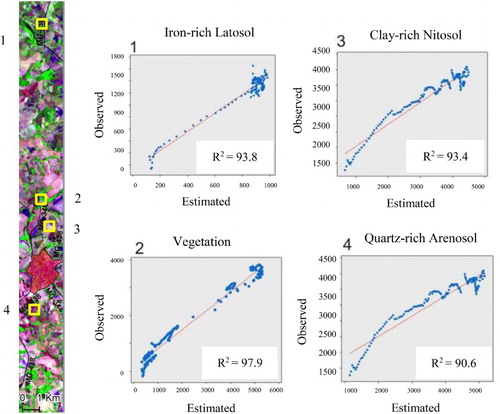
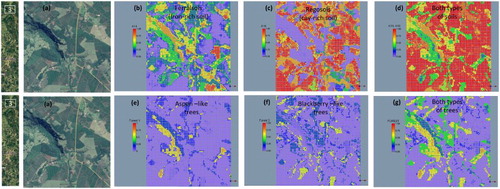
Figure 9. Mapping and verification of fractional landscape components in region 1 of the Hyperion scene: (a) Google Earth image, (b) quartz-rich Arenosols (A9), (c) iron-rich Nitisols (A14), (d) clay-rich Latosols (A16), (e) Forest1 (Aspen-like trees), (f) Forest1 (Blackberry-like trees), (g) FOREST (all), (h) GrassDry (nonphotosynthetically active), (i) Grass (photosynthetically active), (j) GRASS (all).
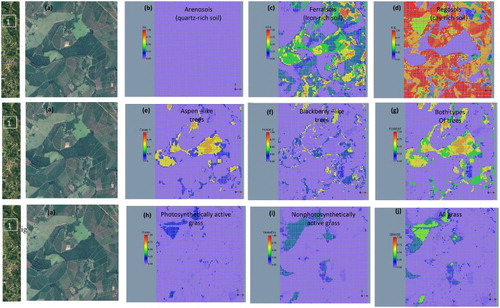
Figure 10. Mapping and verification of fractional landscape components in region 2 of the Hyperion scene: (a) Google Earth image, (b) quartz-rich Arenosols (A9), (c) iron-rich Nitisols (A14), (d) clay-rich Latosols (A16), (e) Forest1 (Aspen-like trees), (f) Forest1 (Blackberry-like trees), (g) FOREST (all), (h) GrassDry (nonphotosynthetically active), (i) Grass (photosynthetically active), (j) GRASS (all).
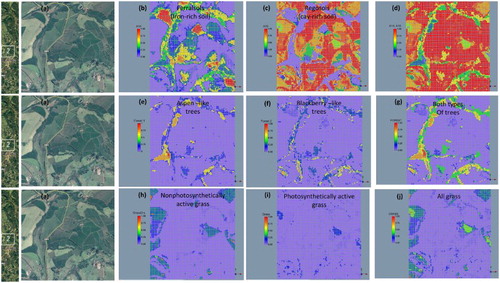
Figure 11. Mapping and verification of fractional landscape components in region 3 of the Hyperion scene: (a) Google Earth image, (b) quartz-rich Arenosols (A9), (c) iron-rich Nitisols (A14), (d) clay-rich Latosols (A16), (e) Forest1 (Aspen-like trees), (f) Forest1 (Blackberry-like trees), (g) FOREST (all).