Figures & data
Figure 1. Screenshots illustrating the three VEs (not to scale).
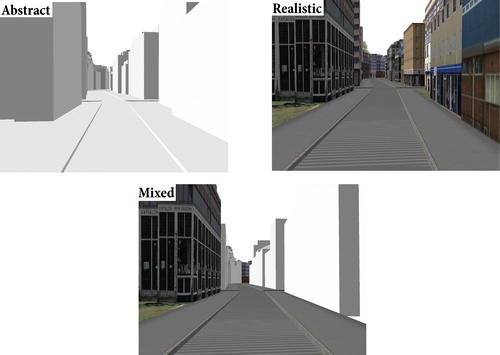
Figure 2. Experimental setup (left-top), the two routes (left-bottom) and the procedure (right).
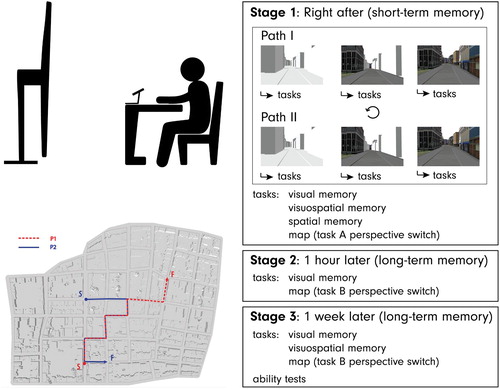
Figure 3. Overall recall accuracy for each VE. Error bars show ±SEM. ***p < .001, *p < 05.
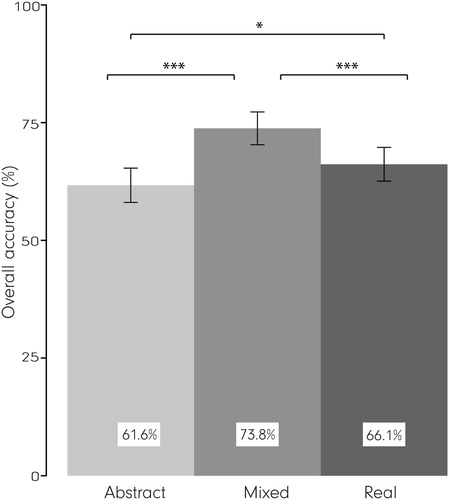
Table 1. Mean recall accuracies, ANOVA (F, p, ηp2, and pairwise comparisons (for statistically significant results).
Figure 4. Interactions between visualization types and task types for recall accuracy rates. Error bars show ±SEM. ***p < .001, **p < .01, *p < 05.
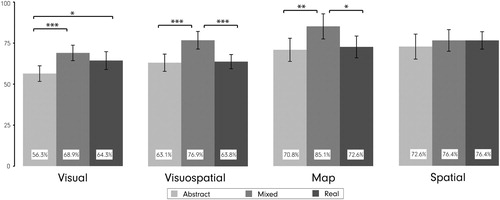
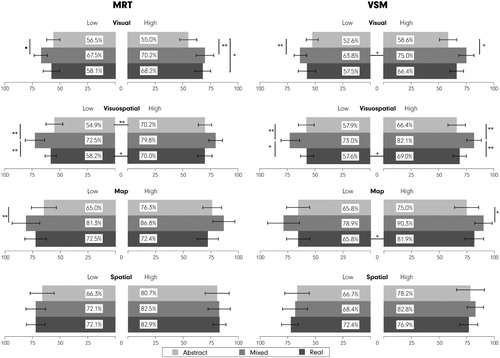
Figure 5. Overall recall accuracy for each visualization type based on MRT- and VSM-split groups. Error bars show ±SEM. ***p < .001, **p < .01, *p < 05.
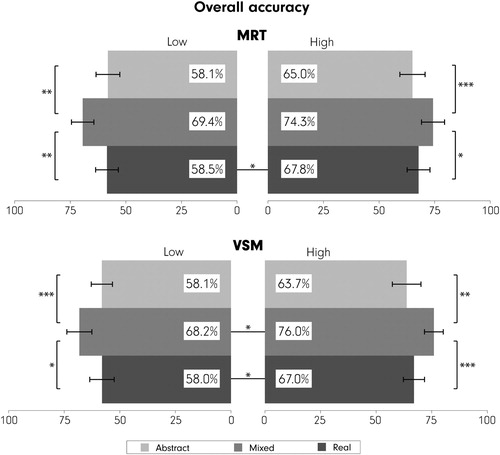
Figure 6. Interactions between the visualization types and task types for the low/high-MRT and low/high-VSM groups’ recall accuracy rates. Error bars ±SEM. ***p < .001, **p < .01, *p < .05.