Figures & data
Figure 1. Two different system architecture options to offer server-based data access and processing. Left: Cloud computing option, where data storage, management and processing are the responsibility of the cloud provider. Right: Web service option, where data storage, management and processing are the responsibility of the data provider. Optimally, in both cases, data users interact with interoperable standard interfaces, such as WCS.
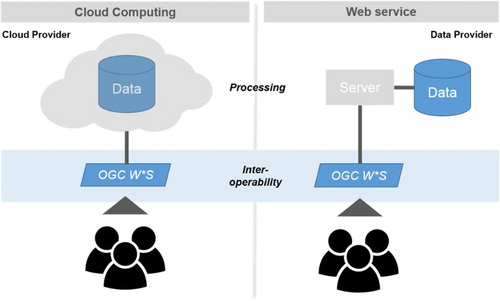
Figure 2. Overview of the OGC interface standards, which geospatial data type is offered by what standard and what output format can be expected.
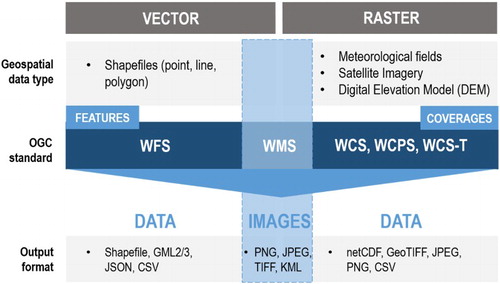
Table 1. Overview of main requirements of a WCS from a data user and a data provider’s perspective.
Figure 3. Integration of a WC(P)S into the common geospatial data analysis workflow. The integration of WCPS requests can benefit technical data users to develop web or desktop applications for decision- and policy-makers.
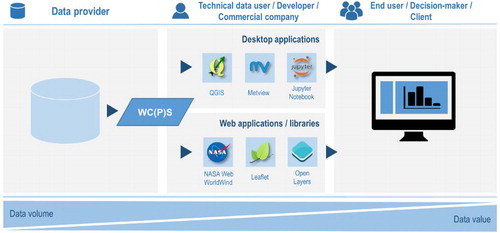
Table 2. Overview of the four WCS’s set-up in the course of EarthServer-2.
Figure 4. A screenshot of the established WebGIS system EO Data Service. The service offers on-demand discovery, access, processing and retrieval of EO data from the Sentinel and Landsat satellites. The example shows the on-demand processing of a L8 image scene in order to retrieve NDVI information for a selected pixel.
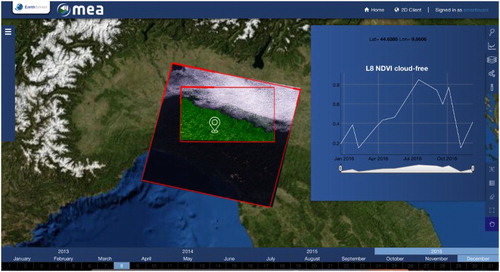
Figure 5. The PlanetServer web client. The left dock shows the projection and base maps selector and the RGB combinator. Spectral data plots from individual pixels can be visualised. The plot dock can load existing spectral data from laboratory samples for analysis.
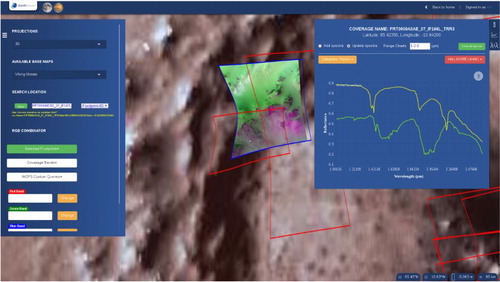
Figure 6. Examples of information required for the climate science community. Above: Surface air temperature for December 2014 relative to the normal period (1981–2010) average. Below: Global monthly surface temperature relative to the 1981–2010 average from January 1979 to Dec 2014. Both graphs are based on ERA-interim reanalysis data.
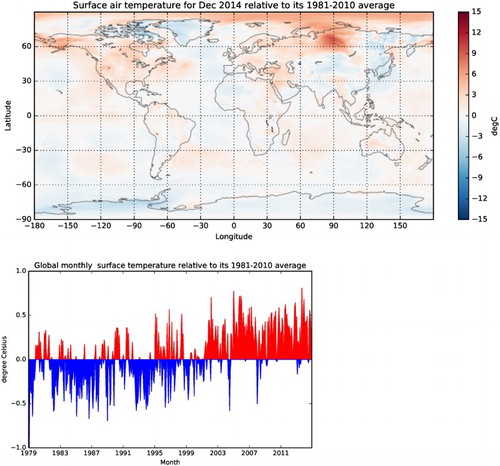
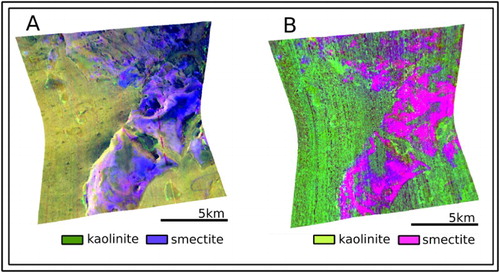
Figure 7. Comparison of different CRISM products for the image FRT0000A053. (A) uses R:BD1900H; G: BD2200; B: D2300 from Pelkey et al. (Citation2007) and (B) uses R: BD1900 2; G: MIN2200; B: D2300 from Viviano-Beck et al. (Citation2014).