Figures & data
Figure 1. Location of the Bohai Sea and distribution of automatic weather stations.
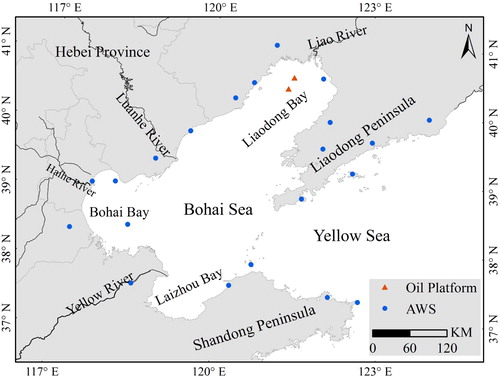
Table 1. The number of MODIS images in each winter.
Table 2. Coefficients used in the calculation of IST in the Northern Hemisphere (Riggs, Hall, and Salomonson Citation2006).
Table 3. Estimated MODIS ice thickness (cm) results from this study, Zeng’s results, and in situ observations at the two offshore oil platforms in Liaodong Bay in the winter of 2009–2010.
Table 4. Estimated MODIS ice thickness (in cm) results from this study, Shi’s results, and in situ observations at the two offshore oil platforms in Liaodong Bay in the winter of 2012–2013.
Figure 2. Retrieved ice thickness at the two oil platforms (JZ9-3 and JZ20-2) during the winter seasons of 2009–2010, based on Zeng’s result, our results (both are derived from MODIS data), and in situ observed ice thickness from Zeng et al. (Citation2016). The index of the horizontal axis refers to time in .
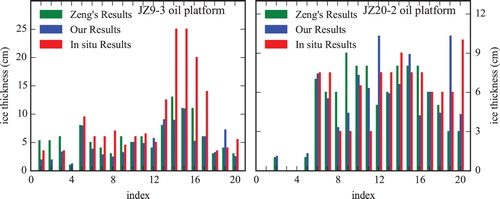
Figure 3. Retrieved ice thickness at the two oil platforms (JZ9-3 and JZ20-2) during the winter of 2012–2013, based on Shi’s result, our results (both are derived from MODIS data), and in situ observed ice thickness from Shi et al. (Citation2016). Vertical bars represent the range of the in situ thickness measure.
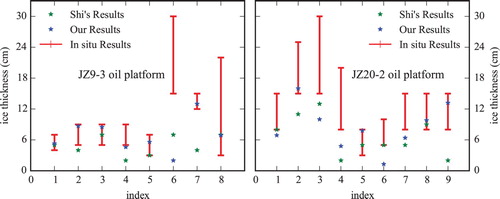
Figure 4. Retrieved ice extent of the Bohai Sea based on MODIS data and previously published results during the winter of 2009–2010.
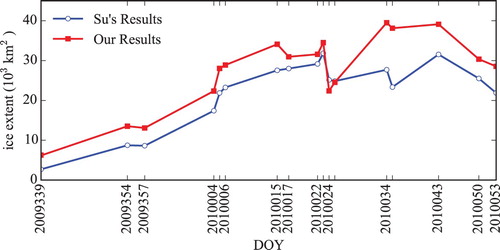
Figure 5. Median values of SIT in the Bohai Sea for six periods from 2000 to 2016.
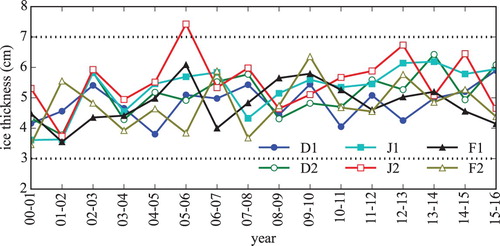
Figure 6. SIT map of the Bohai Sea on the day when the maximum ice extent occurred in the six periods during the winter of 2009–2010.
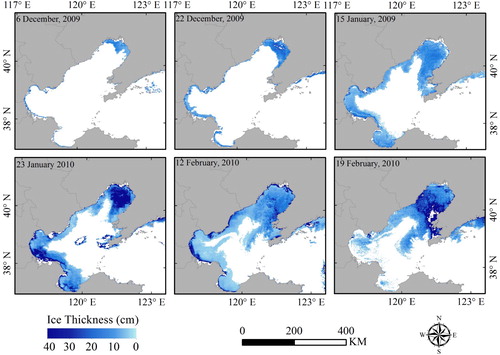
Figure 7. SIT map of the Bohai Sea on the day when the median ice extent occurred in each year during 2000–2016.
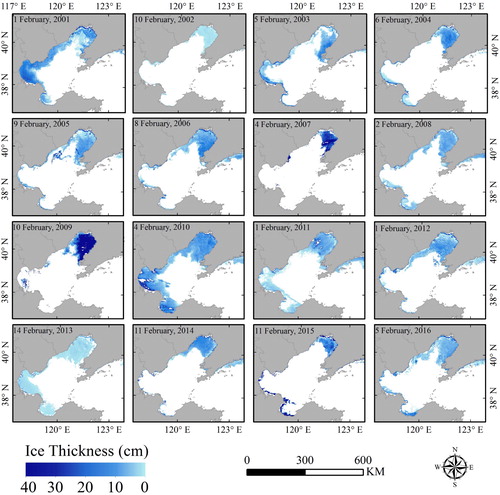
Figure 8. SIE for six winter time periods during 2000–2016 in the Bohai Sea.
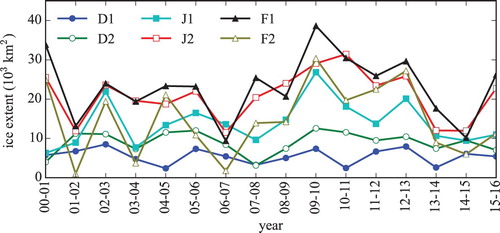
Figure 9. The evolution of negative accumulated temperature, SIE and SIT during 2000–2016.
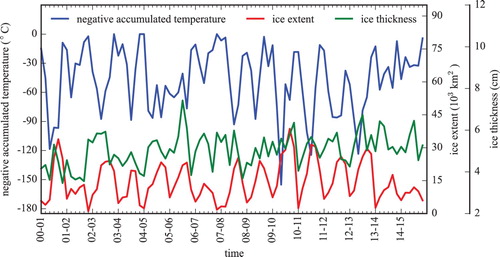
Table 5. Ice thickness, ice extent, and average temperature in the Bohai Sea during the in six winter periods, averaged over years 2000–2016.
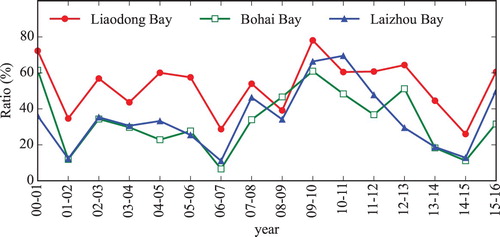
Figure 10. Ratio of median SIE to area of each bay in F1 during 2000–2016.