Figures & data
Figure 1. Non planar graph displayed on a CAVE allowing for immersive visualisation of data (from Garcia-Hernandez et al. Citation2016).Note: CAVE, computer aided virtual environment.
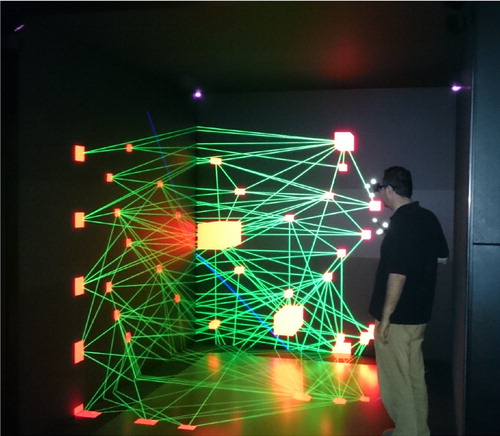
Figure 2. Application of VGE to air pollution analysis (Lin et al. Citation2013).
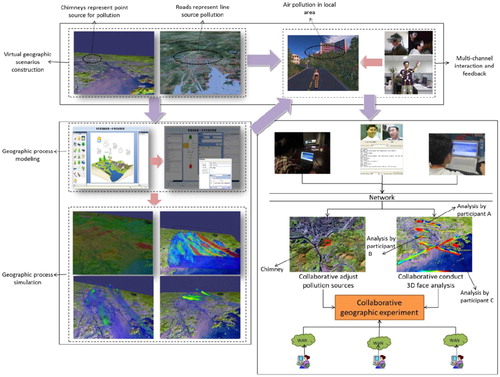
Figure 3. Analysis of groundwater flow patterns in combination with groundwater surface drawdown due to pumping activities for determining subsurface water vulnerabilities utilising the stereoscopic mode of the VISLab (modified from Bilke et al. Citation2014).
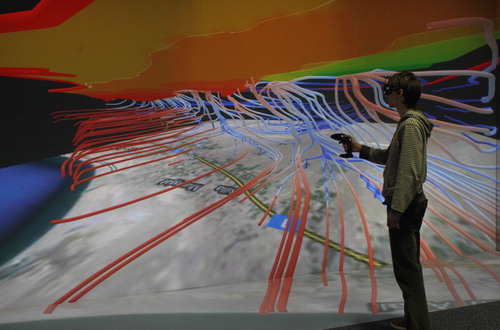
Figure 4. Left and right: analysis of seismic data in an immersive 3D environment (modified from Bilke et al. Citation2014).
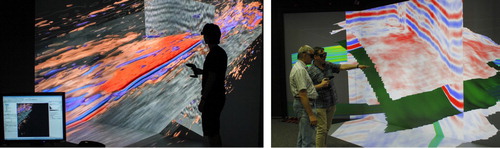
Figure 5. Workflow of dam break risk assessment completed within a collaborative VGE (from Zhu et al. Citation2016).
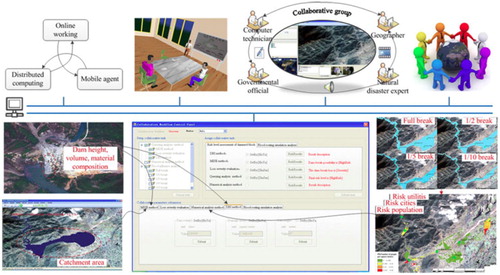
Figure 6. Interactive reconstruction of initial model (right part) before (multiple) fault rupture, starting with the present model to the left and an intermediate model in the middle (from Westerteiger, Citation2014).
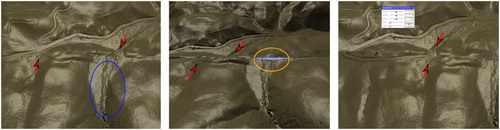
Figure 7. 3D geomodel of a landslide (grey polygon in all figures) and fault scarp site in East Belgium (created with the Leapfrog® software) showing: (a) view to the SE of the shaded LiDAR DEM with location of ERT profile lines (ERT n°3 crosses the fault scarp, ERT n°1 is in the central upper part of the landslide); (b) view to the NE of semi-transparent DEM with ERT profiles across landslide (front) and fault scarp (behind); fault at depth is shaded in grey; (c) view to SE of modelled DEM and subsurface layers, inferred from H/V thickness estimates (colons); (d) view to SE of combined shaded DEM and subsurface layer volumes cut along section AA’ also shown in (c).
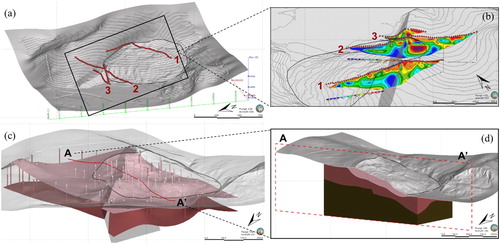
Figure 8. Left part: ‘Virtual Globe’ with implemented low-resolution surface data and recent seismicity (light dots representing M >4.5 events between 1900 and December 2016). Upper right part: regional view of the 3D Tien Shan geohazard database, made with Paraview®, showing the surface (grey-shaded DEM with resolution of 500 m), and two major seismically active fault surfaces (grey-shaded), all known major fault lines (lines), mapped landslides (dots) and earthquake hypocentres coloured according to depth (from 10 km up to more than 100 km depth). Approximate location of Rogun Dam construction site and Minkush site shown (detailed models presented below). Lower right part: view to the East of Longmenshan fault system (from KAUST Repository) activated during the 2008 Wenchuan earthquake, with main shock (dark sphere in lower right part) and about 400 aftershocks (changing size according to increasing magnitude), with part of grey-shaded SRTM 100 m DEM of the region.
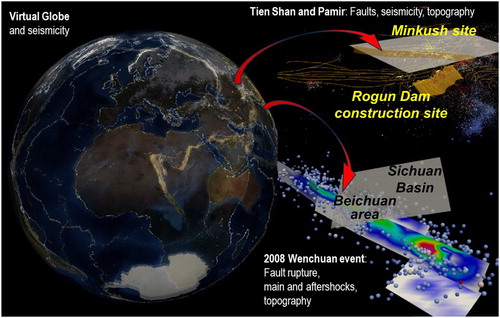
Figure 9. 3D geomodels and numerical simulation results for slopes investigated near the Rogun Dam construction site in Tajikistan. (a) General view of geomodel with textured surface (using Pleiades images) and simplified Rogun Dam model. (b) Surface represented by contour lines allowing for viewing subsurface elements of 3D geomodel, including geological sections (large), modelling section (large), geophysical profiles (small), approximate location of Ionakhsh Fault (see location). (c) Modelling section showing rock falls simulated with UDEC for M∼6.7–6.9 scenario earthquake near site. (d) Simulation results shown in virtual environment.
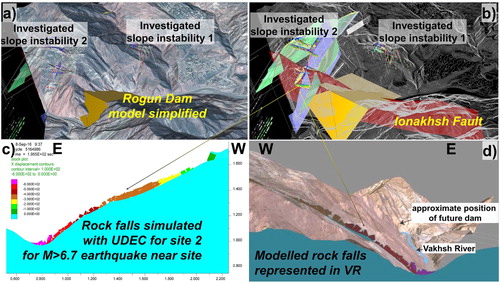
Figure 10. Rogun site in VR. (a) Researcher visiting the site in VR. (b) General semi-transparent surface view showing subsurface profiles. (c) Illuminating collected subsurface data near the Rogun site inside the virtual environment. (d) Visualisation of geophysical (SRT) profile edited (placed at correct location) in VR (modified from Cerfontaine, Mreyen, and Havenith Citation2016).
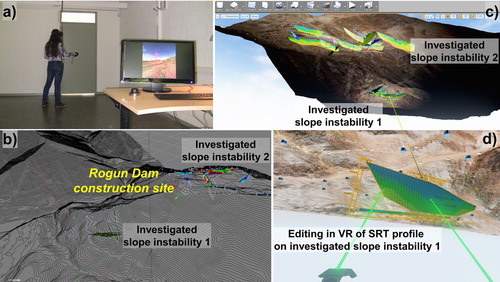
Figure 11. Seismic wave propagation across a 3D model, here shown (with Paraview®) in parallel for successive time steps, but which can also be visualised in our laboratory as animation in VR.
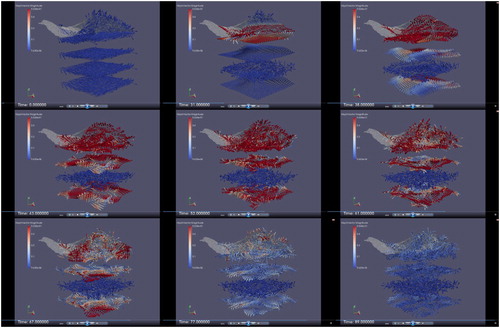
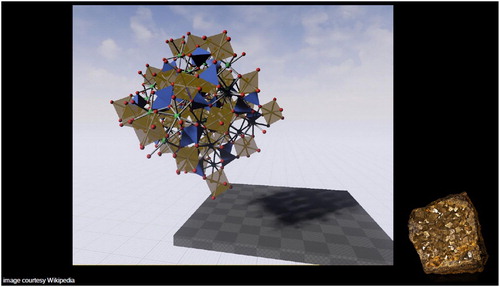
Figure 12. Example of crystal structure, here shown for the Andradite mineral (shown in lower right corner, image courtesy Wikipedia).