Figures & data
Figure 1. Map of Pakistan including the UIB area, its sub-basins, Tarbela dam and study area.
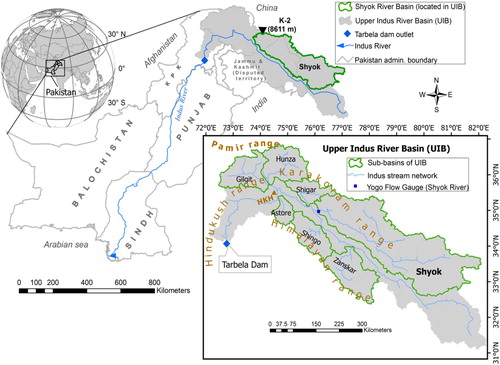
Figure 2. GDEM of the Shyok River basin showing five altitudinal zones, glacier coverage across them, and overlaid by the hydro-climatic gauging stations.
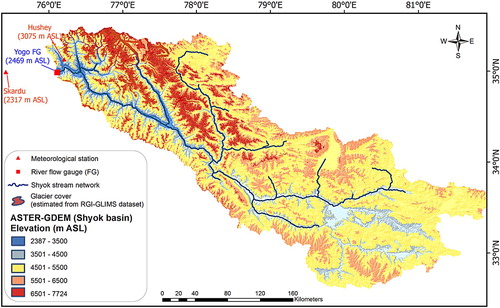
Figure 3. Hypsometric curve and the distribution of area under 500-m elevation bands for the Shyok River basin (estimated from ASTER GDEM).
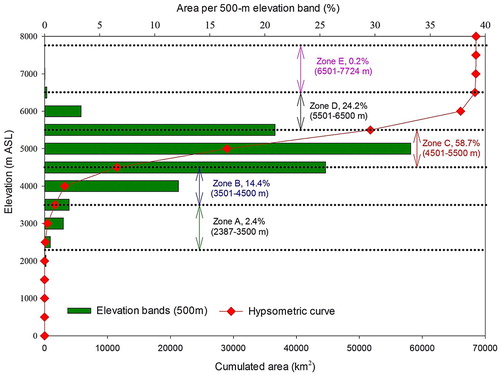
Table 1. Key features of the study area (Shyok River basin).
Table 2. Main features of the elevation zones extracted from the ASTER GDEM.
Figure 4. Mean monthly SCA variations in the Shyok River basin as extracted from MODIS snow products.
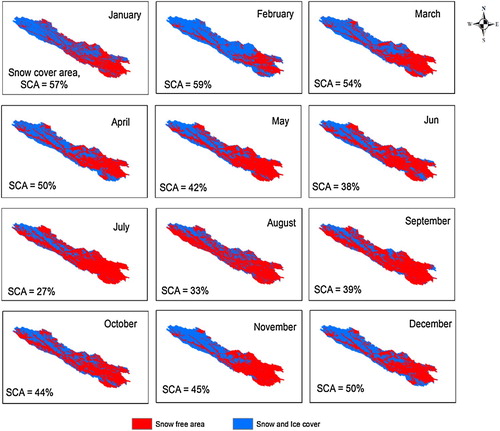
Table 3. SRM parameters to be calibrated.
Figure 5. Snow cover distribution (basin-wide) in the Shyok River basin estimated from MODIS snow images over a period of 2000–2006.
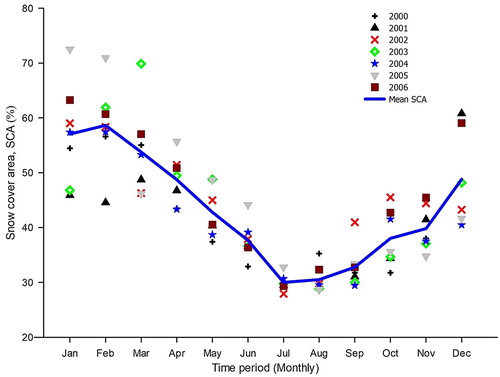
Figure 6. Monthly temperature variations in different elevation zones of the study area. The data for all the elevation zones are estimated from the actual data of neighbouring Skardu climate station by using the temperature lapse rate of 0.65°C/100 m.
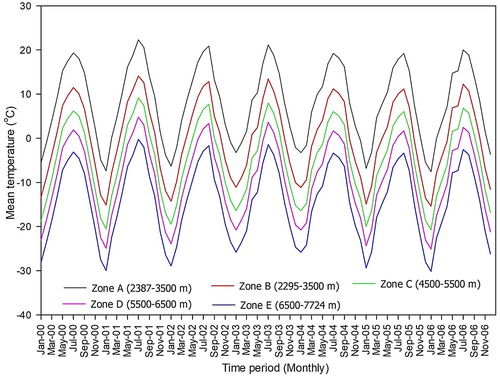
Figure 7. Snow cover distribution in five different altitudinal zones of the Shyok River basin estimated from the remotely sensed MODIS (MOD10A2) snow cover data.
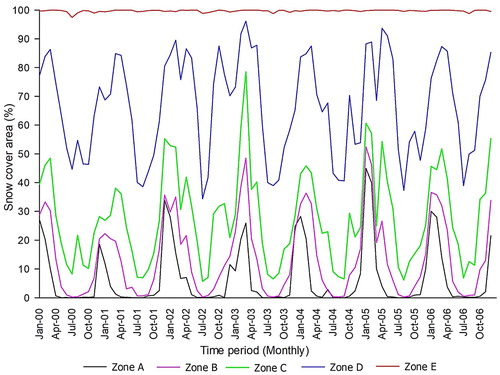
Table 4. Efficiency of the basin-wide application of SRM over calibration and validation period (2000–2006) for the simulation of Shyok river discharge.
Figure 8. Evaluation of basin-wise (BW) SRM application (2000–2006) to the Shyok River basin during the snowmelt period (April–September).
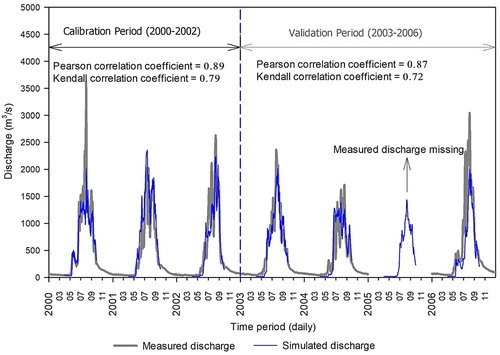
Table 5. Basin-wide parametric values for the successful simulation of Shyok river discharge for years 2000−2006.
Table 6. Efficiency of the zone-wise application of SRM over calibration and validation period (2000–2006) for the simulation of Shyok river discharge.
Figure 9. Evaluation of zone-wise SRM application (2000–2006) to the Shyok River basin during the snowmelt period (April–September).
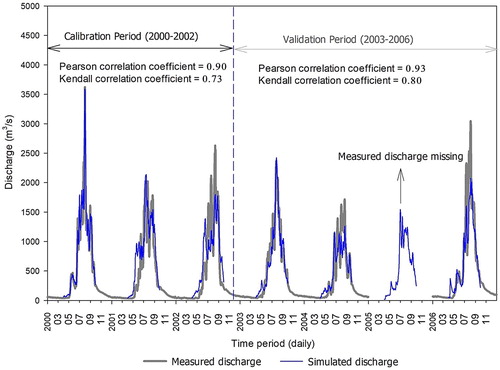
Table 7. Zone-wise parametric values for the successful simulation of Shyok river discharge for years 2000−2006.
Figure 10. Evaluation of basin-wide (BW) and zone-wise (ZW) SRM application over the hydrological year 2003 in the Shyok River basin. Upper panel shows the variation in mean monthly SCA for a hydrological year in the catchment.
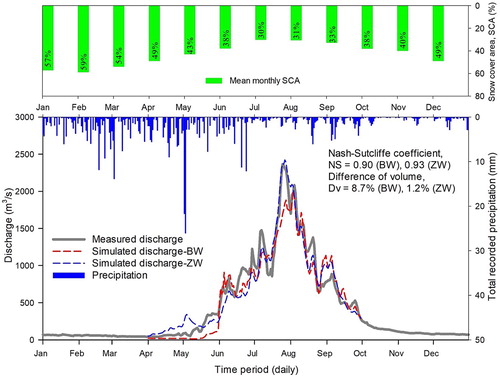
Figure 11. Comparison of basin-wide (BW) and zone-wise (ZW) simulated runoff by applying the SRM over the years (2000–2006).
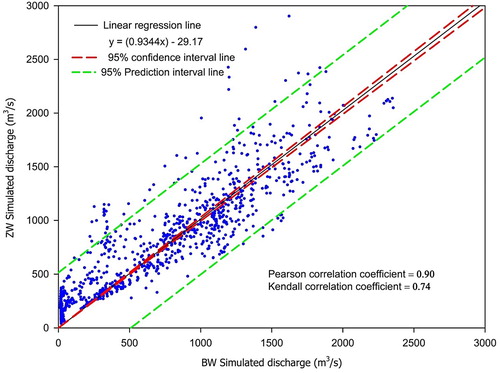
Figure 12. Mean monthly discharge simulations in the Shyok River under the SCA change scenarios. Discharge measured for year-2000 is used as current discharge.
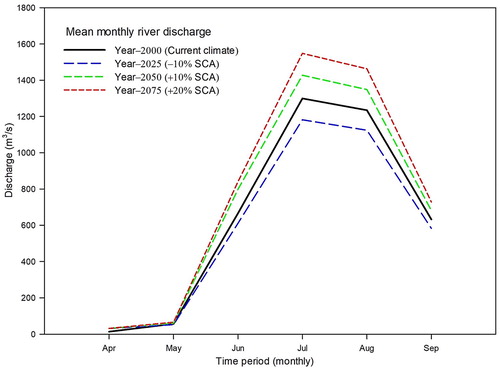
Figure 13. Monthly discharge simulations in the Shyok River for different climate change (mean temperature) scenarios. Discharge simulated for 2000 with the SRM is used as current discharge.
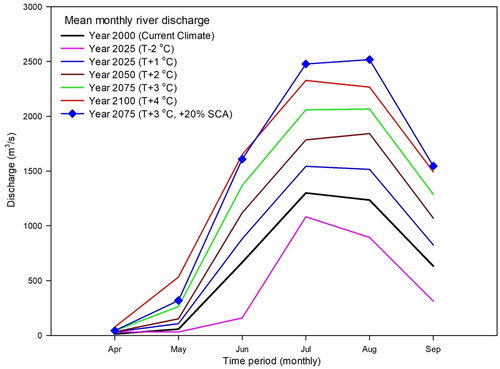
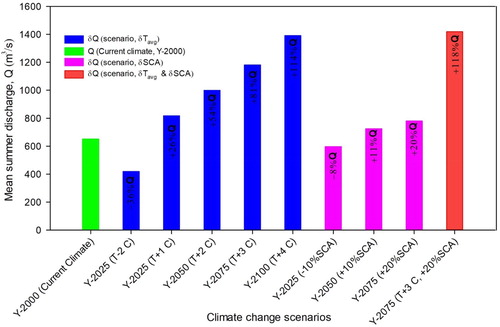
Figure 14. Change in mean seasonal (summer) discharge (δQ) under future scenarios of change in mean temperature (δTavg) and mean SCA (δSCA).