Figures & data
Figure 1. Additional depth cues available in different kinds of environments.
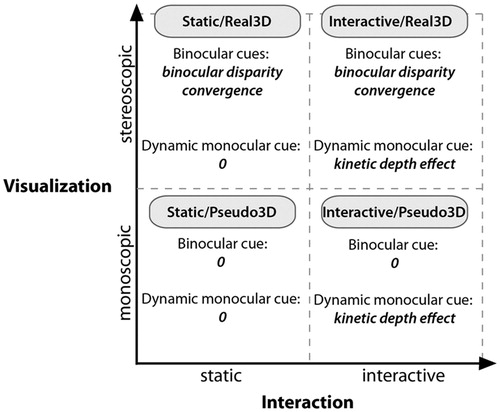
Figure 2. Design of the experiment.
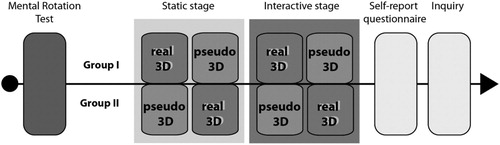
Figure 3. The first part of the experiment, the MRT.
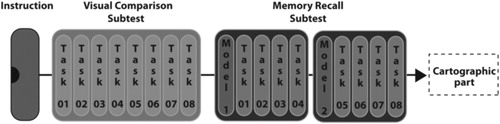
Figure 4. An example of the task from the visual comparison sub-test.
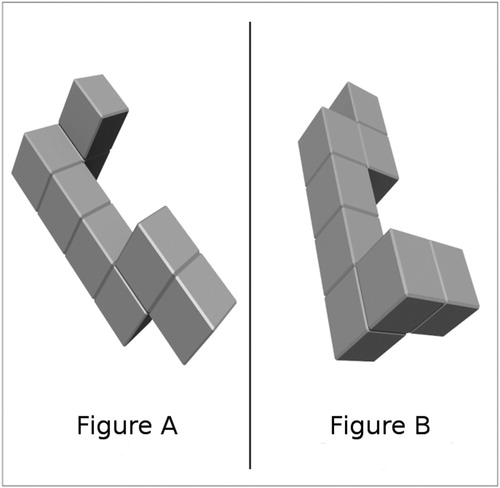
Figure 5. An example of the model figure and figure that follows it from the memory recall sub-test.
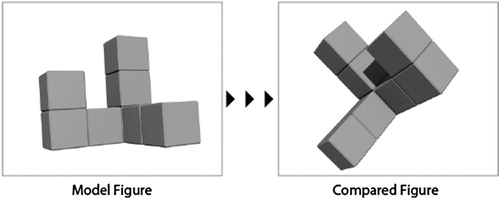
Figure 6. Detailed schema of the second part of the experiment.
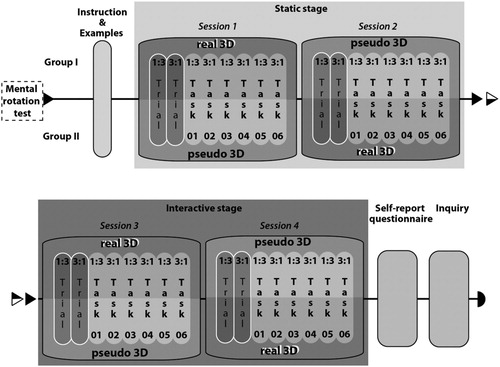
Figure 7. An example of a ‘1:3’ task. The terrain model with a single pair of connected points is rendered on the left side of the screen. Three different altitude profiles are displayed on the right side – one of them corresponds to the terrain in the model. Screenshot from the testing application.
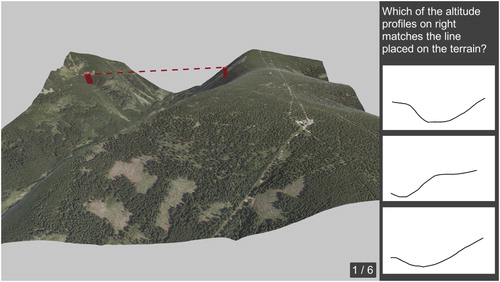
Figure 8. Example of a ‘3:1’ task. The terrain model with three pairs of connected points is rendered on the left side of the screen. A single altitude profile is displayed on the right side. One of the three terrain profiles between the connected points corresponds to the altitude profile. Screenshot was taken from the testing application.
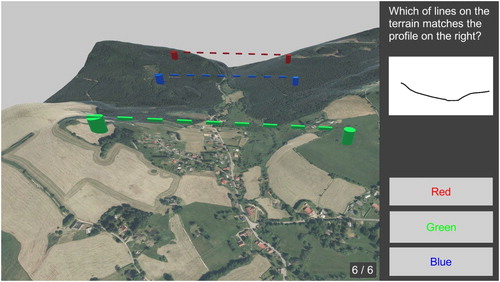
Figure 9. Number of correct answers in the altitude profile estimation. N = 39 in all conditions. Pseudo 3D (static M = 5.00, SD = 1.34; interactive = 5.74, SD = 1.33) and real 3D (static M = 5.15, SD = 1.66; interactive = 5.77, SD = 1.39).
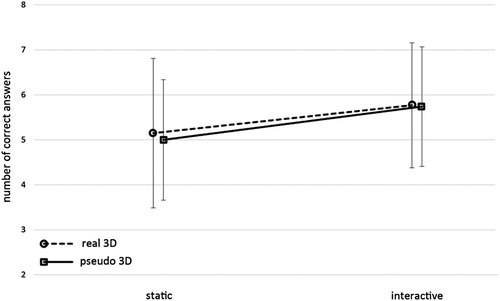
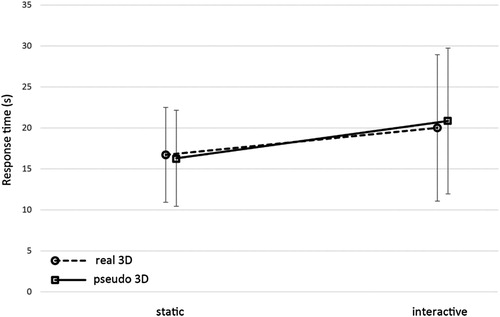
Figure 10. Response time (s) in the altitude profile task. N = 39 in all conditions. Pseudo 3D (static M = 16.30, SD = 5.86; interactive = 20.85, SD = 8.89) and real 3D (static M = 16.72, SD = 5.79; interactive = 20.01, SD = 8.94).