Figures & data
Figure 1. Study area.
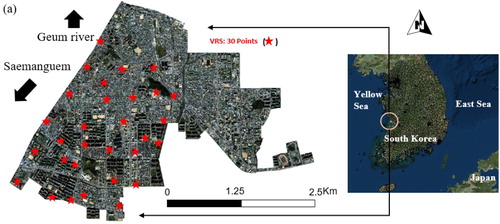
Figure 2. Equipment used in this research.
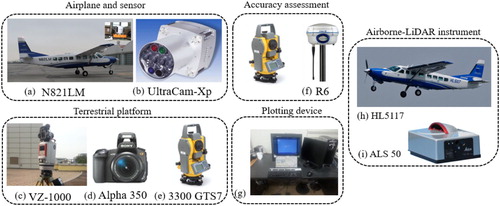
Figure 3. Steps (a)–(c) for developing an automated 3-D city model.
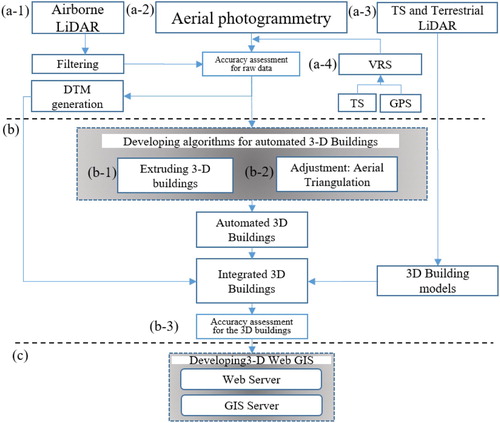
Figure 4. DTM generation process: Filtering and DTM generation.
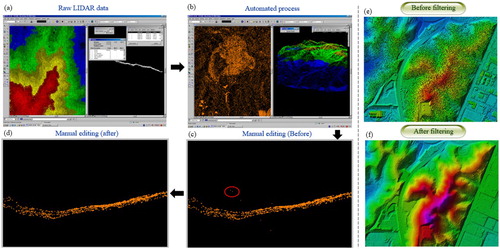
Figure 5. Developing algorithms for automated 3-D building models.
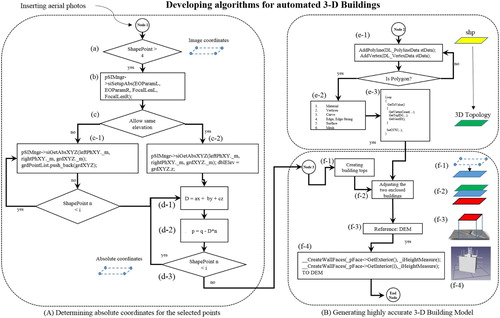
Figure 6. Demonstrating the processes for building 3-D objects.
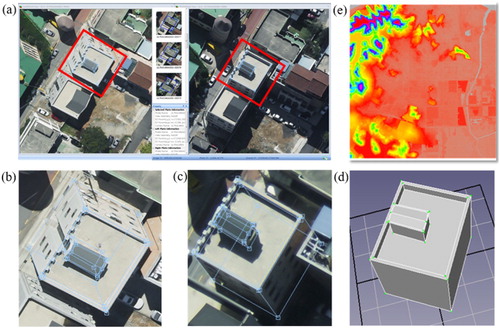
Figure 7. Improving positional accuracy of the 3-D building model.
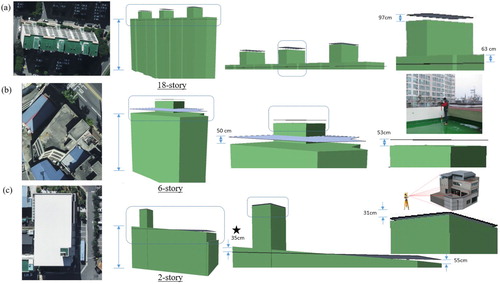
Figure 8. 3-D building reconstruction utilizing inflection points acquired by TS.
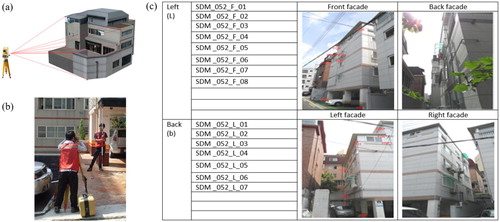
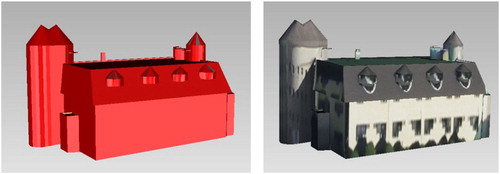
Figure 9. 3-D building model by the TS technique.
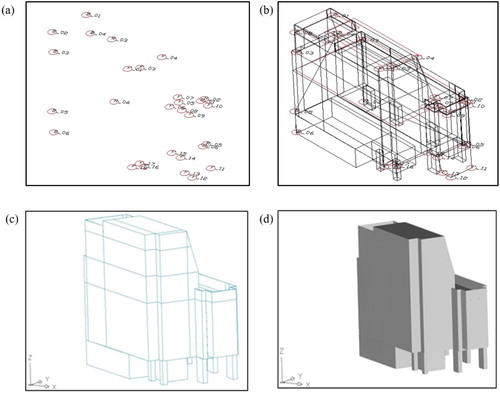
Figure 10. Photorealistic 3-D building model by a terrestrial laser scanner.
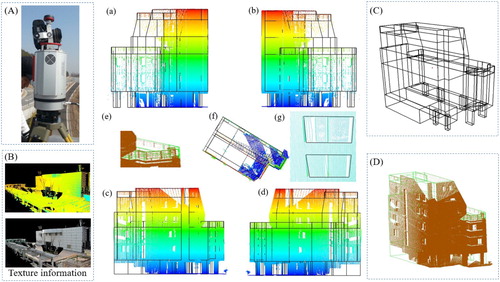
Figure 11. Accuracy assessment by measuring VRSs and control points.
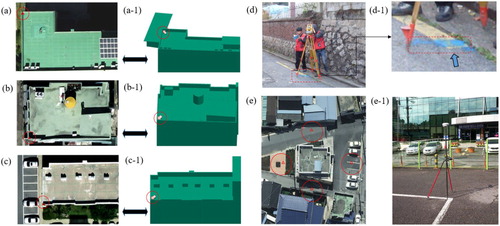
Table 1. Comparing horizontal and vertical locations with VRS positions.
Table 2. t-Test statistic result.
Figure 12. Normal distribution of the t-test statistics.
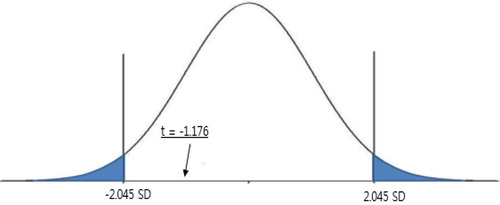
Figure 13. Area-based assessment for correctness.
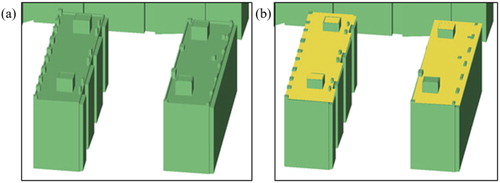
Figure 14. Comparing 3-D buildings with LiDAR point clouds.
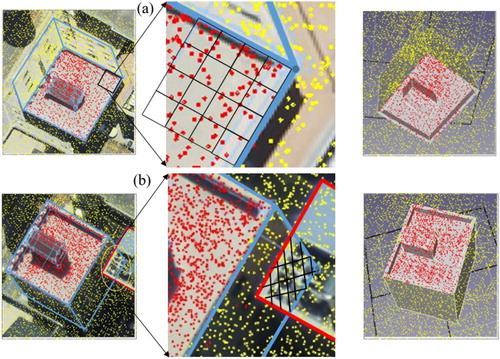
Figure 15. Developing a GIS database and a 3-D Web GIS Server for 3-D city model.
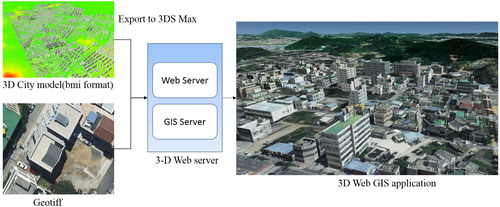
Figure 16. 3-D building modeling and texturing generated by aerial photos.