Figures & data
Figure 1. The cruise trajectory (blue line) of the R/V Xuelong during observation of ice conditions, with the dates of some turning points (triangle) (A-E) marked in the map. The background was the averaged sea ice concentration derived from AMSR2 data between 2 August 2014 and 1 September 2014.
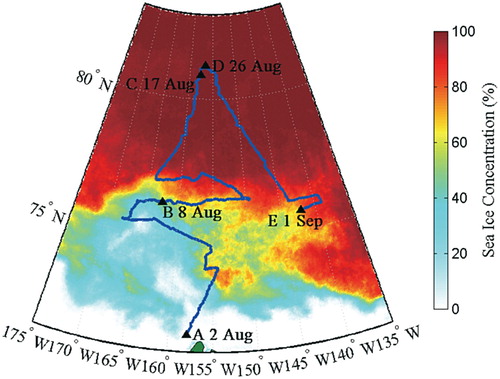
Figure 2. Instruments onboard R/V Xuelong used for observations of (a) sea ice concentration and (b) sea ice thickness.
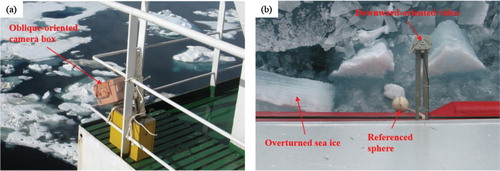
Figure 3. One frame containing a whole overturned level ice cross section captured from shipborne video. In this image, A1B1, A2B2, and A3B3 are ice thicknesses in cross section and CD is the diameter of referenced sphere within the frame.
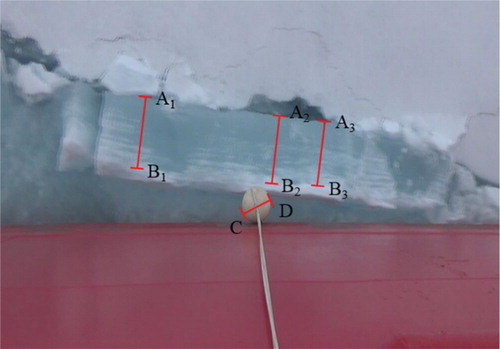
Figure 4. Typical oblique-oriented photos of ice conditions during the cruise; (a–e) are from the northward cruise while (f–,g) are from the southward.
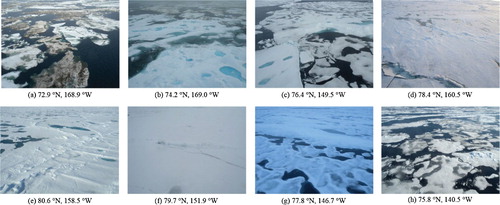
Figure 5. The distribution of sea ice thickness along the cruise (black line). The discontinuity in this figure denotes open water or the duration of the long-term ice camp in the northernmost region.
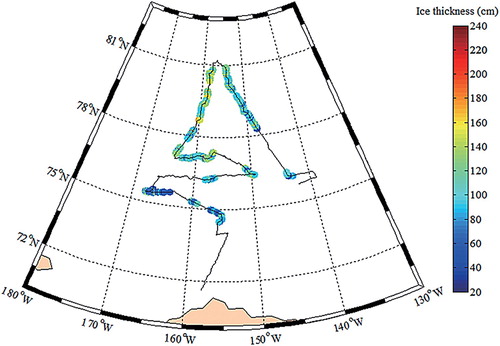
Figure 6. The probability density of sea ice thickness in the regions of (a) MIZ, (b) PIZ, and (c) the whole cruise. As shown are the normal distribution curves fitting the sea ice thickness distribution in the PIZ and the whole cruise.
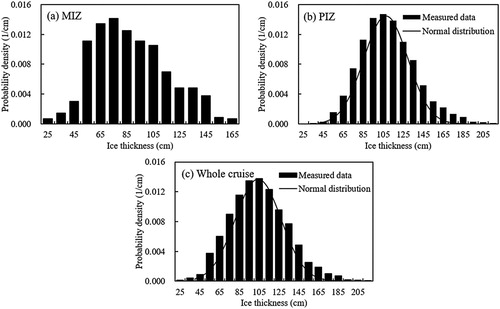
Figure 7. Average sea ice thicknesses at each latitude and standard deviations along the cruise. Also shown are the regression lines (dash lines) and varying gradients in MIZ and PIZ.
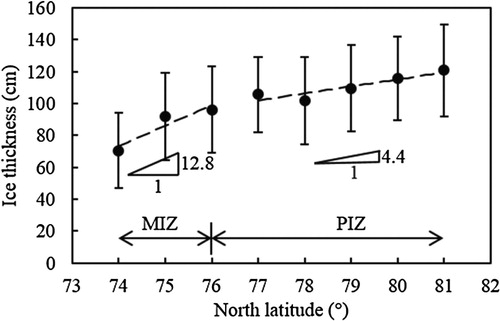
Figure 8. Variations of the area fractions of (a) water, (b) pond, and (c) sea ice along the cruise (black line) obtained from the oblique photography of sea ice onboard R/V Xuelong.
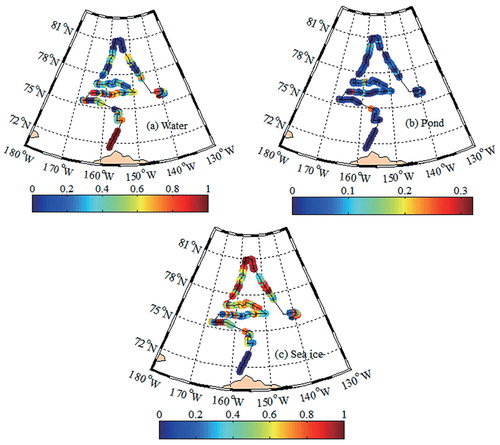
Figure 9. Cumulative frequency distributions of the area fractions of (a) water, (b) pond, and (c) sea ice in MIZ, PIZ, and throughout the whole cruise when extreme regions (i.e. between 0 and 0.1 and between 0.9 and 1.0 for water and sea ice, respectively, and between 0 and 0.1 for melt pond) were abandoned.
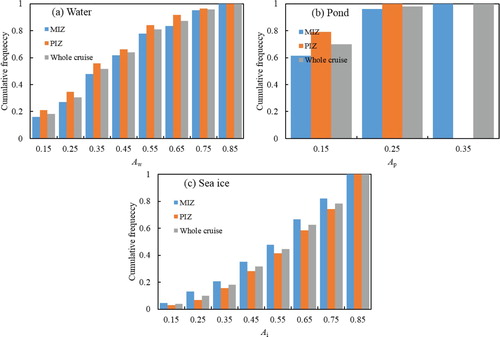
Figure 10. Average area fractions and standard deviations of water, pond, and sea ice.
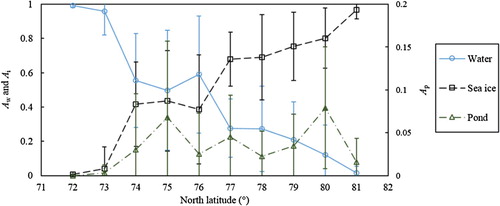
Figure 11. SIC derived from shipborne observations and its moving average along the cruise route. SIC values from SSMIS (25 km) and AMSR2 (25 km) data are shown for comparison. The MIZ, PIZ, location of the LIC, and a special area A with explanations in context are shown.
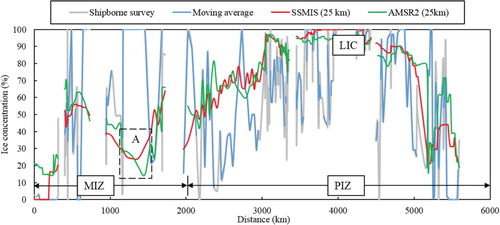
Table 1. Mean sea ice concentration derived from moving averages and RS for different sections.
Figure 12. The impact of Ap on differences between satellite-derived and shipborne sea ice concentration for (a) SSMIS (25 km) and (b) AMSR2 (25 km) in the MIZ and PIZ.
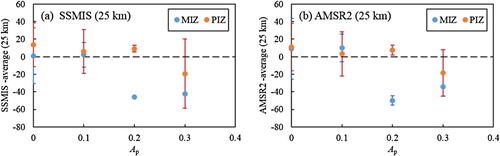
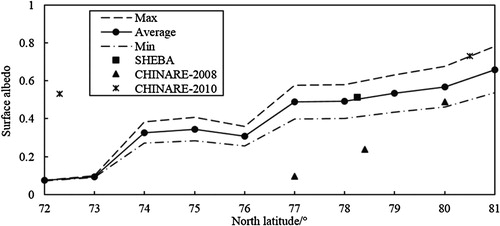
Figure 13. Maximum, average, and minimum broadband surface albedos at each latitude calculated using image-derived average area fractions during the CHINARE-2014 cruise. Surface albedos from other cruises (SHEBA, CHINARE-2008 and CHINARE-2010) are shown for comparison.