Figures & data
Figure 1. Study Area 1, Maros Regency, South Sulawesi, Indonesia.
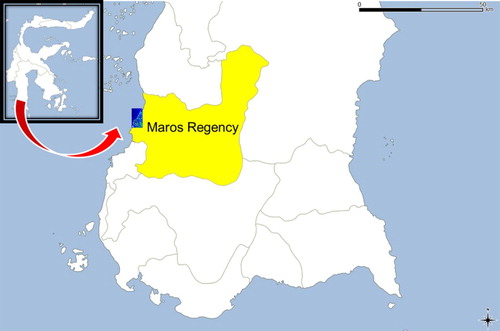
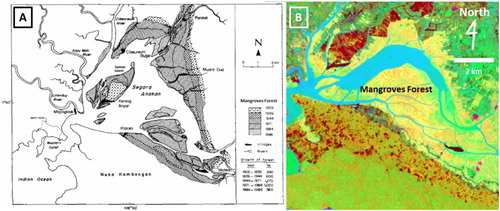
Figure 2. Study area 2, Segara Anakan, Cilacap Regency, West Java.
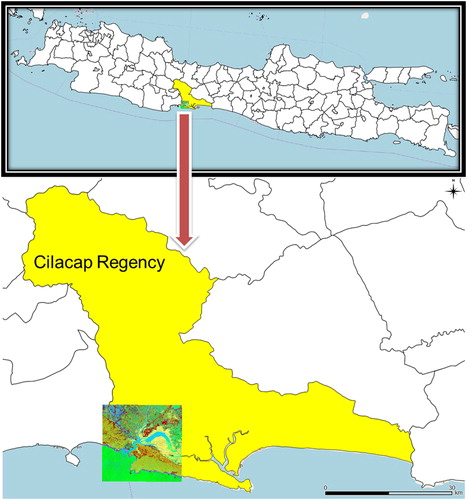
Figure 3. Flowchart of PPS indices transformation and evaluation.
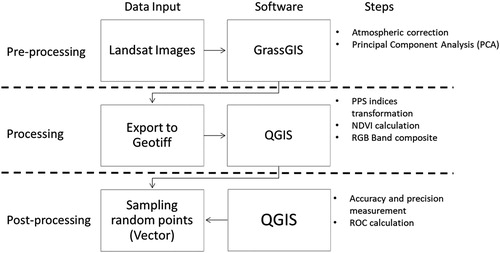
Figure 4. Contingency table and performance metric calculation of ROC.
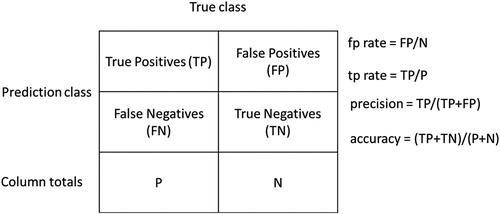
Figure 5. Mangroves species distribution in the study area.
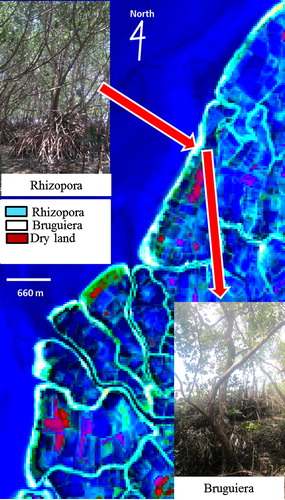
Figure 6. Mangroves species of Bruguiera is dominant along the coastline and located between Rhizophora.
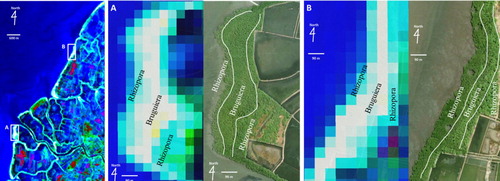
Figure 7. Processed image of mangrove forest in Maros Regency using PPS indices multi-bands (left) and conventional RGB (542) multi-bands without transformation (right).
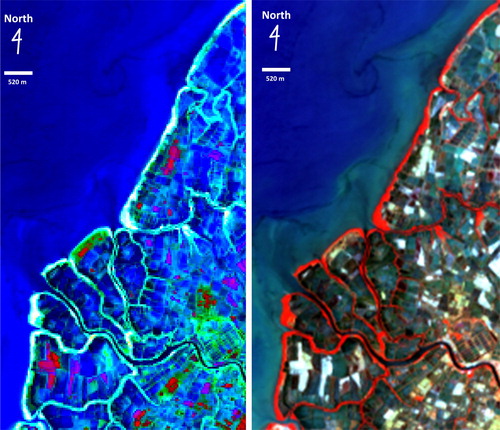
Table 1. Accuracy assessment result of Bruguiera.
Table 2. Accuracy assessment result of Rhizophora.
Figure 8. Mangrove forests in Segara Anakan. A. Mangrove forests are isolated in three different colors; green, yellow, and orange, B. Conventional RGB (542) multi-bands without transformation only show the vegetation in red without any detail differentiation.
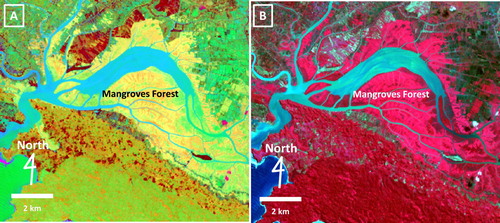
Figure 9. A. Scatterplot of a regression model of PPSB vs. NDVI, where r2 = 0.877. B. A regression model of PPSG vs. NDVI, where r2 = 0.021. C. A regression model of PPSW vs. NDVI, where r2 = 0.094.
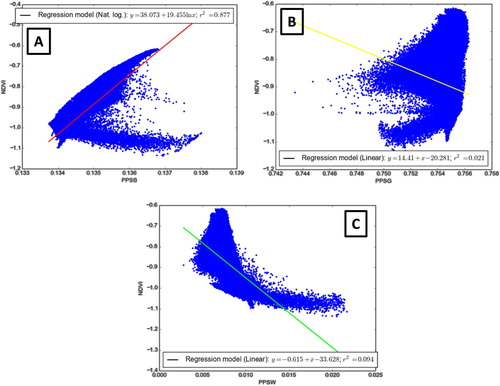
Figure 10. Cross-section line location (A to B) to extract PPSB values.
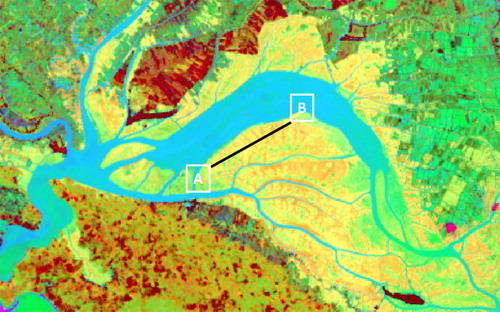
Figure 11. Extracted values of PPSB image from cross-section line features (A to B).
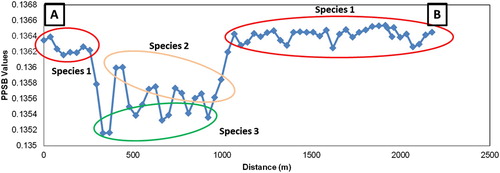
Figure 12. ROC graph of PPS indices (A) and NDVI indices (B).
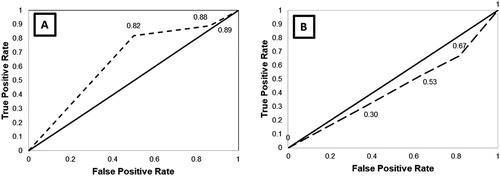
Figure 13. A. Shoreline and mangroves forest growth from 1903 to 1986 (White, Martosubroto, and Sadorra Citation1989); B. Mangroves forest in 2014.