Figures & data
Figure 1. Fire sample across the boreal plains ecozone.
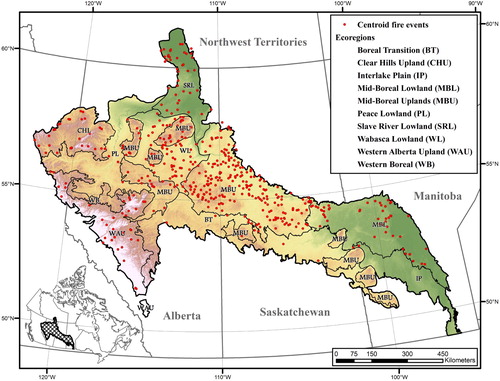
Table 1. Physical and biological characteristics of the ecoregions with 30 or more fires within the BP ecozone. Based on the Terrestrial Ecozones of Canada (Wiken Citation1986).
Figure 2. Analysis workflow.
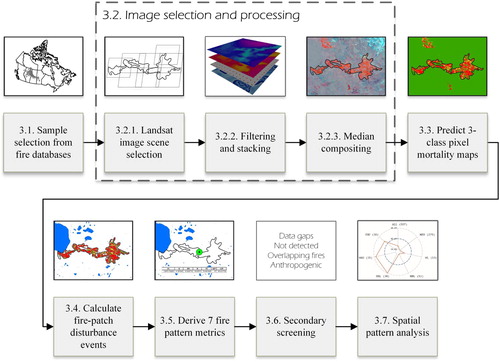
Figure 3. Process to derive a disturbance event.
Notes: The top thumbnail represents the difference between pre- and post-fire composites, where the red channel corresponds to the difference in Landsat NIR band (4 in TM and 5 in OLI), the green channel to the difference in the SWIR 1 band (5 in TM and 6 in OLI) and the blue channel the difference in the SWIR 2 band (7 in TM and OLI). The middle thumbnail represents the three-class mortality map from the RF classifier, where green corresponds to unburned, yellow to partial mortality and red complete mortality. The bottom figure corresponds to the disturbance event by Andison (Citation2012), where red corresponds to disturbed, yellow to IR and dark green to MR (colour online only).
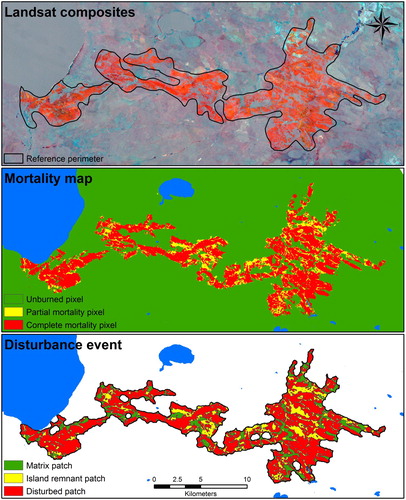
Table 2. Description of the seven fire pattern metrics calculated on the disturbance events. Based on Andison (Citation2012).
Figure 4. Number of observations per pixel for the image compositing averaged by individual fires.
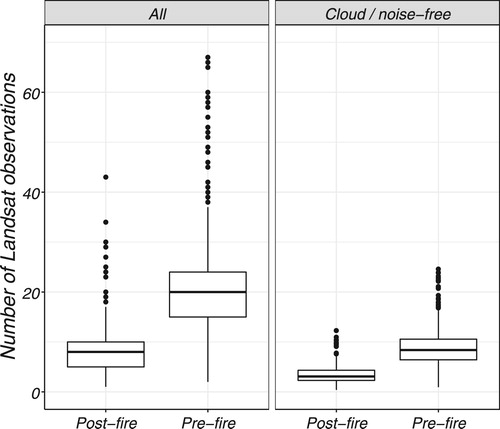
Figure 5. Time difference (days) for the image compositing averaged by individual fires.
Notes: ‘Median’ corresponds the distance in days between the selected median pixel and a hypothetical fire occurring the 1st of August of the fire year reported in the fire history databases. ‘Closest’ is the nearest observation in days from a hypothetical fire occurring the 1st of August of the fire year.
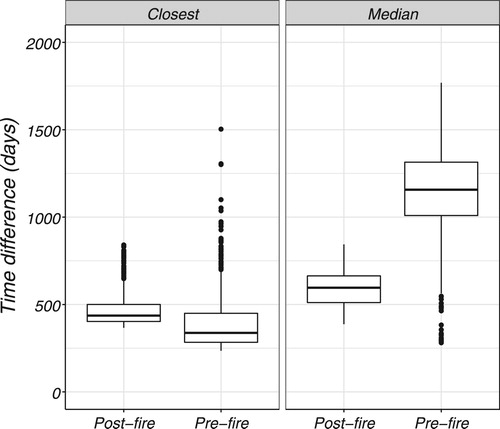
Figure 6. Summary of the screening process.
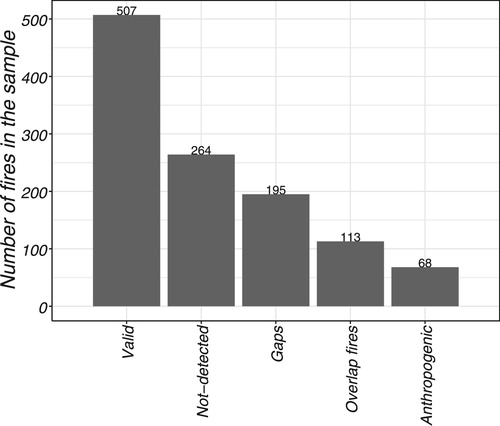
Figure 7. Summary boxplots of the comparison between ecoregions.
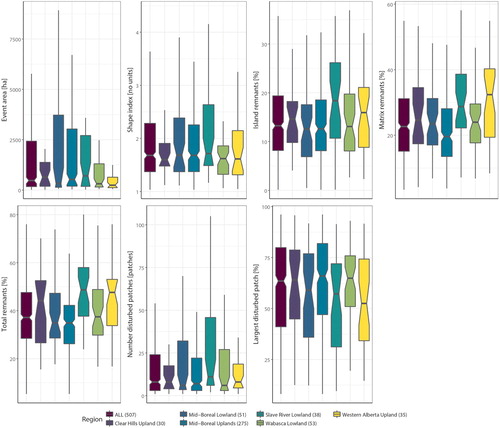
Figure 8. Spyder plot grouped by fire pattern metric and significant differences in the cumulative distribution functions by ecoregion pairs (in box).
Notes: The spyder plots are calculated using the median of each metric. The maximum and minimum values for each metric correspond to the maximum and minimum ecoregion values for each metric. EA is event area; SI is the shape index; %TR is the percentage of remnant islands; %IR is percentage of island remnants; %MR is the percentage of matrix remnants; NDP is the number of disturbed patches; and %LDP is the percentage of the largest disturbed patch. ALL stands for all fires combined; MBU for Mid-Boreal Uplands; WL for Wabasca Lowland; MBL for Mid-Boreal Lowlands; SRL for Slave River Lowlands; WAU for Western Alberta Uplands; and CHU for Clear Hills Uplands. The significant differences by the combination of WX and the KS tests at the .01 significance are represented in the box at the right hand side.
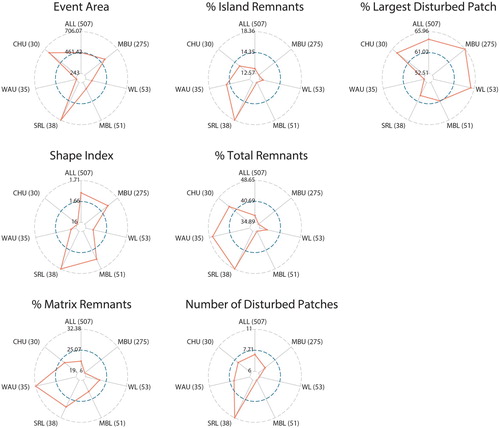
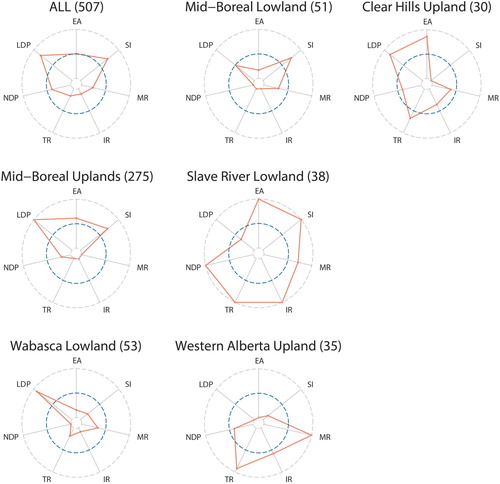
Figure 9. Spyder plot by ecoregion.
Notes: The spyder plots are calculated using the median of each metric. The maximum and minimum values for each metric correspond to the maximum and minimum ecoregion values for each metric. EA is event area; SI is the shape index; %TR is the percentage of remnant islands; %IR is the percentage of island remnants; %MR is the percentage of matrix remnants; NDP is the number of disturbed patches; and %LDP is the percentage of the largest disturbed patch.