Figures & data
Figure 1. Image tiles of GlobeLand30.
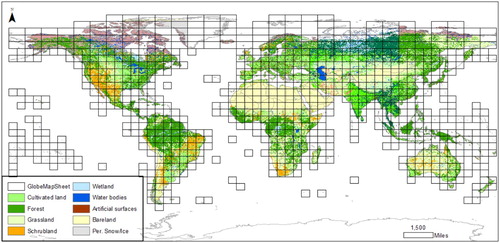
Table 1. Land cover nomenclature of GlobeLand30 (Chen et al., Citation2015a).
Figure 2. Flowchart of the study.
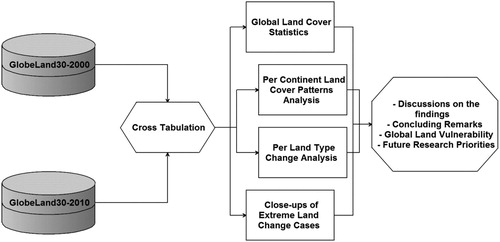
Table 2. The extent of land cover types across the globe in terms of square kilometres.
Figure 3. The variation of cultivated lands (a), artificial surfaces (b), forests (c), grasslands (d), scrublands (e), wetlands (f), barelands (g), and water bodies (h) across different continents within 2000–2010.
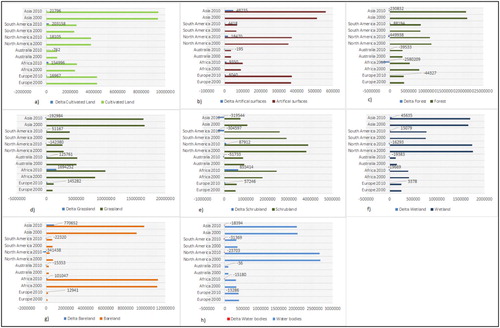
Figure 4. Land cover change statistics across Europe within 2000–2010.
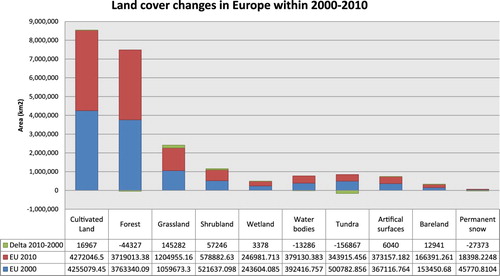
Figure 5. Spatial patterns of land cover change in Europe and the changes within 2000–2010 are represented in red colour (colour online only).
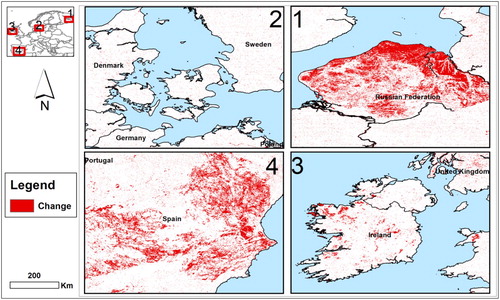
Figure 6. Land cover change statistics across Asia within 2000–2010.
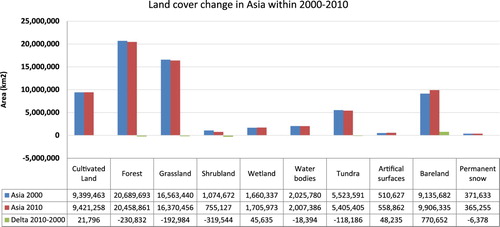
Figure 7. Spatial patterns of changes for four selected vibrant spots within 2000–2010 in Asia are represented in red colour (colour online only).
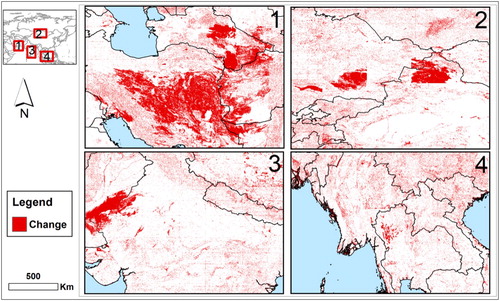
Figure 8. Land cover change statistics across North America within 2000–2010.
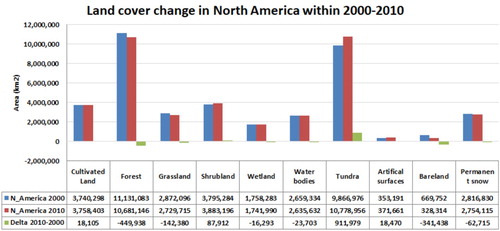
Figure 9. Spatial patterns of changes in North America within 2000–2010 are represented in red colour (colour online only).
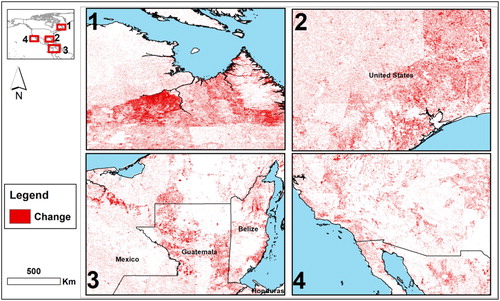
Figure 10. Land cover change statistics across South America within 2000–2010.
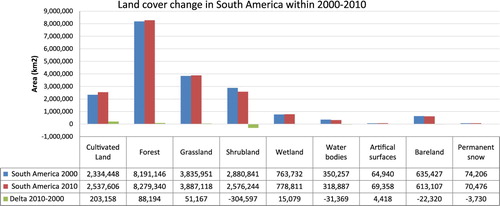
Figure 11. Spatial patterns of land cover in South America and the changes within 2000–2010 are represented in red colour (colour online only).
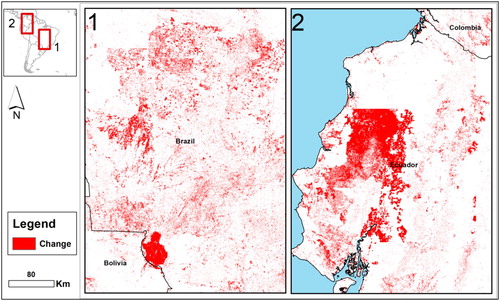
Figure 12. Land cover change statistics across Australia within 2000–2010.
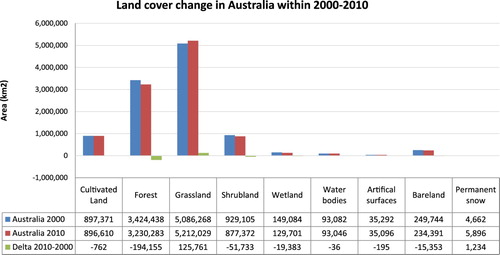
Figure 13. Spatial patterns of land cover changes across Australia within 2000–2010 are represented in red colour (colour online only).
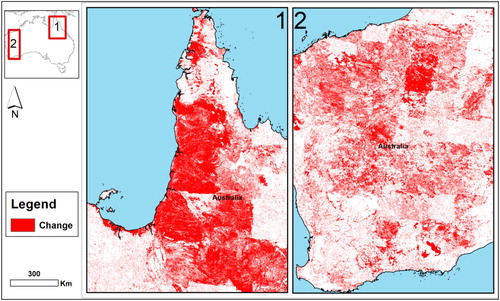
Figure 14. Land cover change statistics across Africa within 2000–2010.
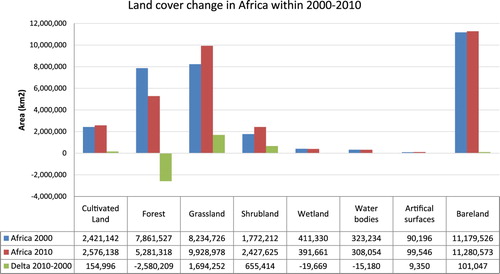
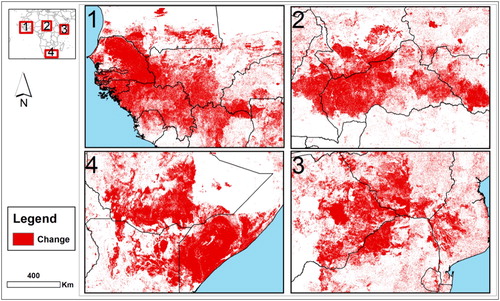
Figure 15. Spatial patterns of land cover changes across Africa for four selected close-ups within 2000–2010 are represented in red colour (colour online only).