Figures & data
Figure 1. The study area located in Beijing, China.
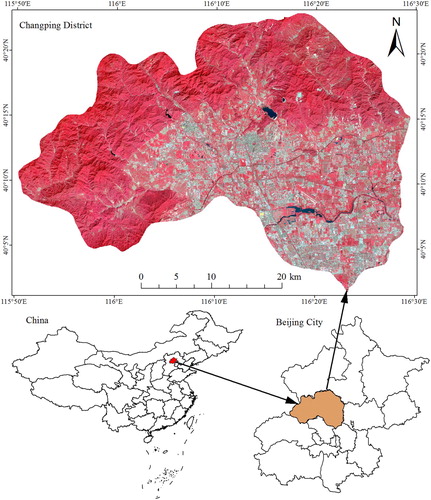
Table 1. Object features used for classification.
Figure 2. Importance of the features based on the ReliefF method and Cfs results at the segmentation scales of 30 and 60. (Here, a checkmark means that the feature is included in the optimal subset).
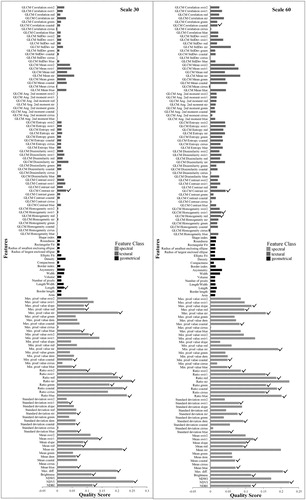
Figure 3. Overall accuracy of the four classifiers with different combinations of shape and compactness at segmentation scales of 30 and 60.
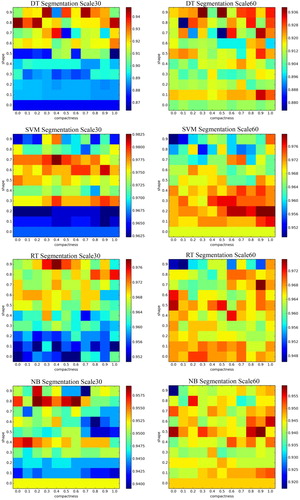
Table 2. Values of shape and compactness corresponding to Max A and Min A with different classifiers.
Figure 4. Number of objects at segmentation scales of 30 and 60 with different combinations of shape and compactness.
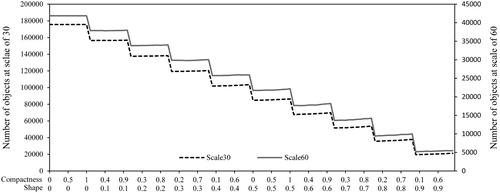
Figure 5. Overall accuracy of the four classifiers with increasing segmentation scale size.
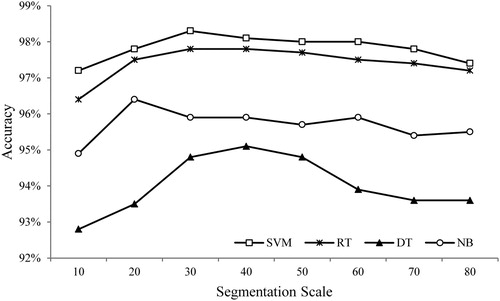
Table 3. Z-statistics of the classification results.
Figure 6. Overall accuracy of a decision tree with increasing maximum depth values at different segmentation scale sizes.
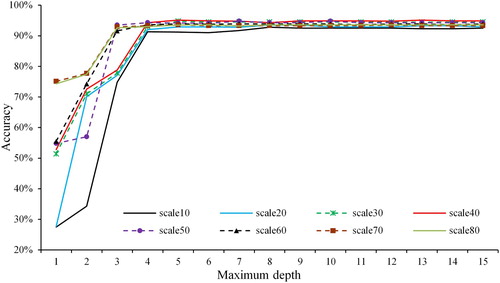
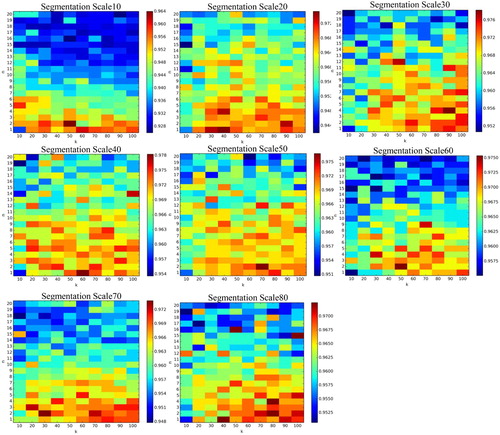
Figure 7. Overall accuracy of a support vector machine with different values of C and gamma at different segmentation scale sizes.
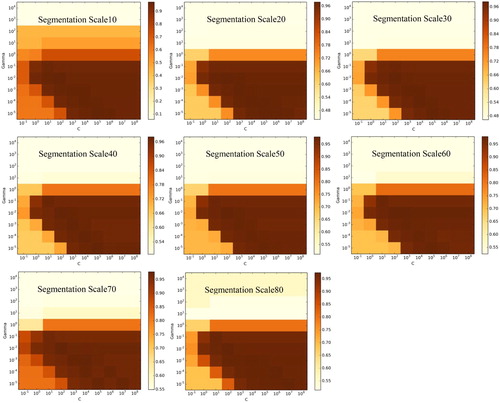
Figure 8. Overall accuracy of a random tree with different values of k and n at different segmentation scale sizes.