Figures & data
Figure 1. Research data, field survey location, subarea and validation samples.
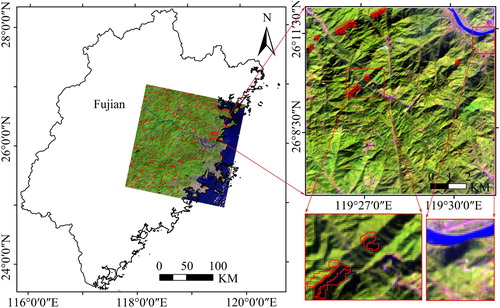
Figure 2. Schematic diagram of terrain shadows.
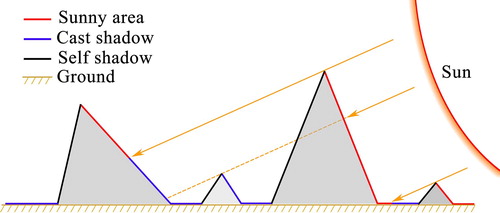
Figure 3. TOA reflectance of six land-cover types (left) and VI values on shady and sunny slopes (right).
Note: bands #1–2 represent red and near-infrared wavebands, respectively (left); slopes #1–2 represent vegetation on shady slopes and sunny slopes without shadow, respectively (right).
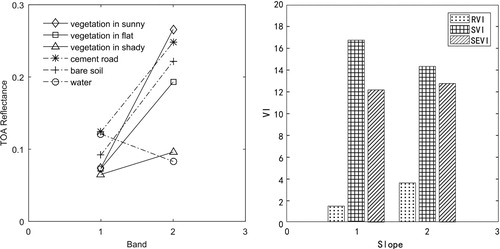
Figure 4. Curves for f (Δ) optimization.
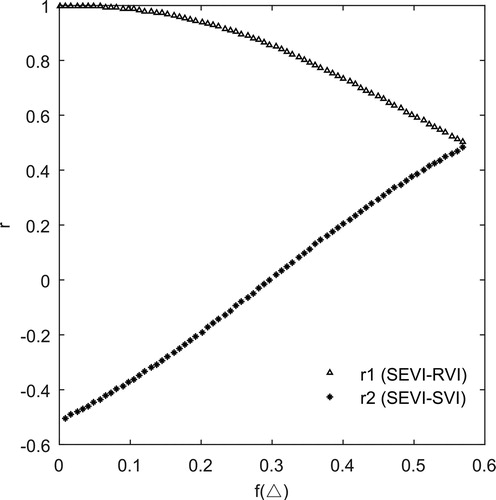
Figure 5. Vegetation indices in the research area.
Note: a–c, j represent vegetation indices computed from the TOA reflectance data, d–f represent vegetation indices computed from the C model corrected data, g–i represent vegetation indices computed from the 6S + C corrected data, and k represents cosi.
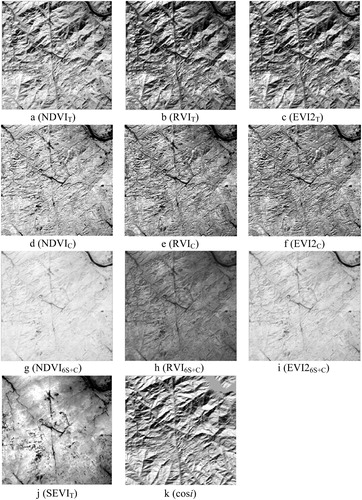
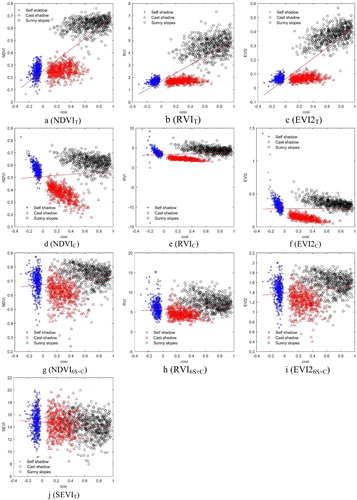
Figure 6. Plots of vegetation indices for 532 sets of samples.
Note: a–c, j represent vegetation indices computed from the TOA reflectance data, d–f represent vegetation indices from the C model corrected data, and g–i represent vegetation indices from the 6S + C corrected data.
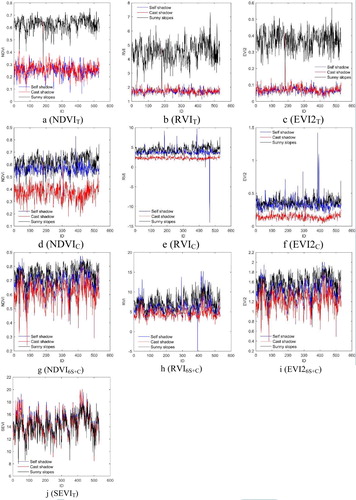
Table 1. Mean (M) and relative error (E) of vegetation indices in self shadows, cast shadows and sunny slopes.
Figure 7. Scatter plots of vegetation indices and cosi with 532 sets of samples.