
Figures & data
Figure 1. The research area in the Upper Citarum watershed, West Java Province, Indonesia.
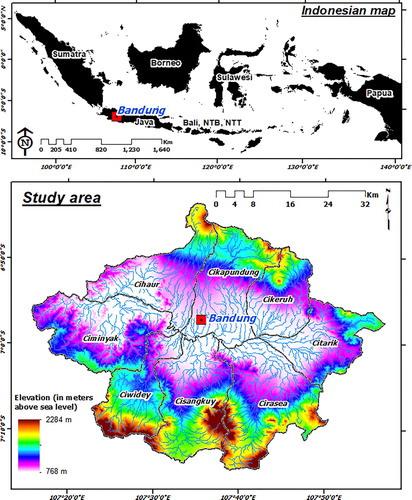
Table 1. Types of spatial data used in this study.
Figure 2. Flowchart of the research.
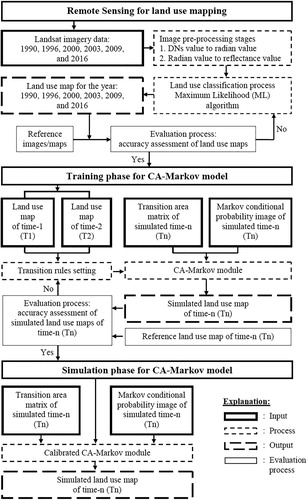
Figure 3. Example the validation and proportion training samples based on the making the Grid Index Feature (GIF) with a size of 2 km×2 km was used to determine the number of sample points in the calculation accuracy of assessment. In stratified sampling can be obtained a total of 650 points based center point of each polygon GIF. (A, C) SPOT 6 in 2016. (B,D) Land use map in 2016 based on the classification using Maximum Likelihood algorithm.
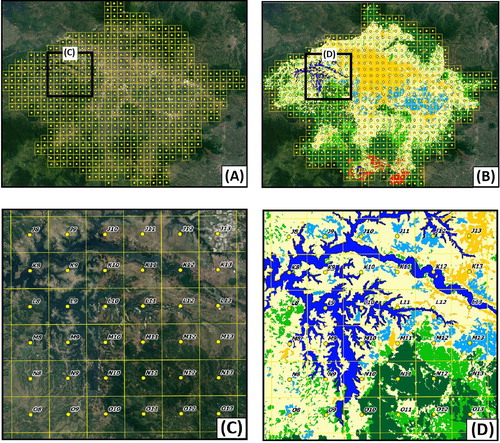
Figure 4. The results of multi-temporal land use mapping in 1990 to 2016 based on the supervised classification using the ML algorithm. (A) 1990, (B) 1996, (C) 2000, (D) 2003, (E) 2009, (F) 2016.
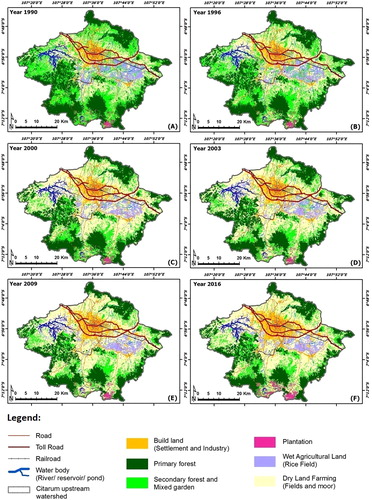
Table 2. The percentage area of the dynamics land use changes in 1990 to 2016.
Table 3. The estimate of average area land use changes in 1990 to 2016.
Figure 5. Inputs and parameters to create a transition potential map (A) elevation. (B) Distance from the primary road. (C) Distance from the secondary road. (D) Distance from the river. (E) Distance from reservoir and pond. (F) Result of transition potential map.
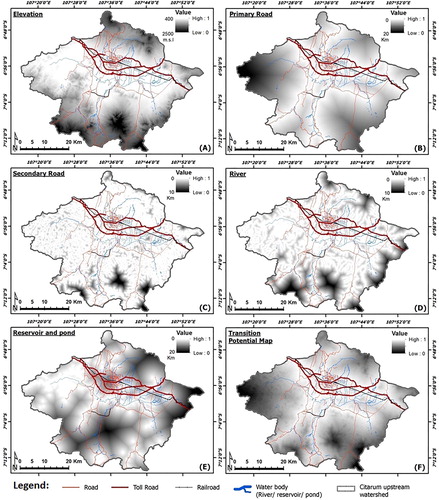
Figure 6. (A) Land use simulated in 2016 using input data from the year 1990 and 1996. (B) Land use simulated in 2016 using input data from the year 1990 and 2000. (C) Land use simulated in 2016 using input data from the year 1990 and 2003. (D) Land use simulated in 2016 using input data from the year 1990 and 2009. (E) Land use simulated in 2016 using input data from the year 1996 and 2000.
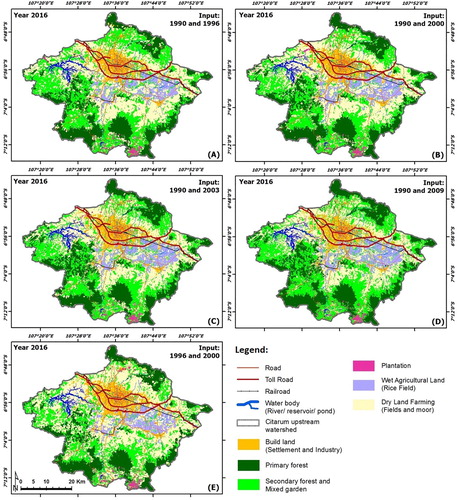
Figure 7. (A) Land use simulated in 2016 using input data from the year 1996 and 2003. (B) Land use simulated in 2016 using input data from the year 1996 and 2009. (C) Land use simulated in 2016 using input data from the year 2000 and 2009. (D) Land use simulated in 2016 using input data from the year 2000 and 2009. (E) Land use simulated in 2016 using input data from the year 2003 and 2009.
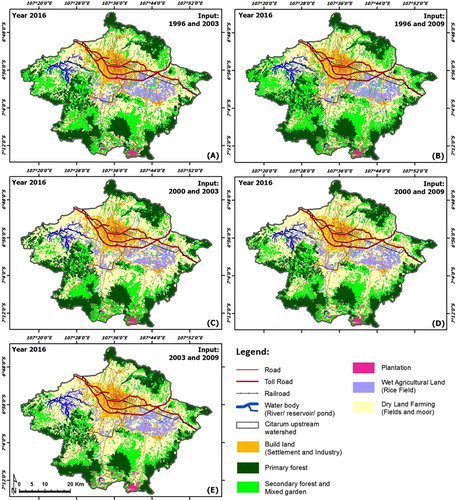
Figure 8. The result of validation maps using three-map comparison obtained by overlaying the reference map of time 1, the reference map of time 2, and the prediction map for time 2.
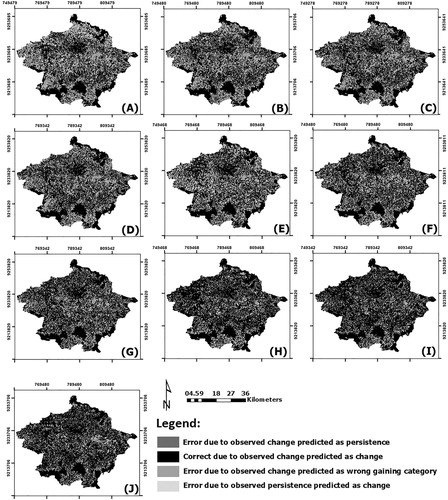
Table 4. The results of calculation accuracy assessment or validation maps using three-map comparison obtained by overlaying the reference map of time 1, the reference map of time 2, and the prediction map for time 2.
Figure 9. Future land use simulated in 2025 to 2050 for optimistic scenarios with the percentage values for figure of merit, producer's accuracy, and user's accuracy are 72.5%, 78.5% and 79.6%, respectively.
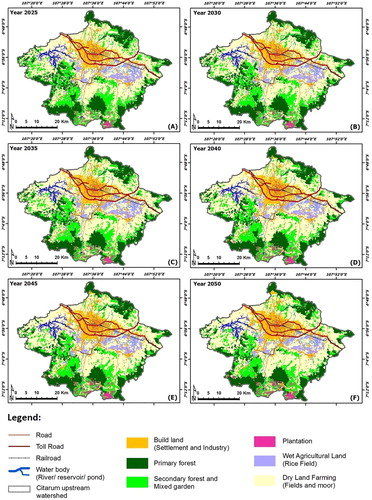
Figure 10. Future land use simulated in 2025 to 2050 for pessimistic scenarios with the percentage values for figure of merit, producer's accuracy, and user's accuracy are 50.7%, 57.3% and 56.4%, respectively.
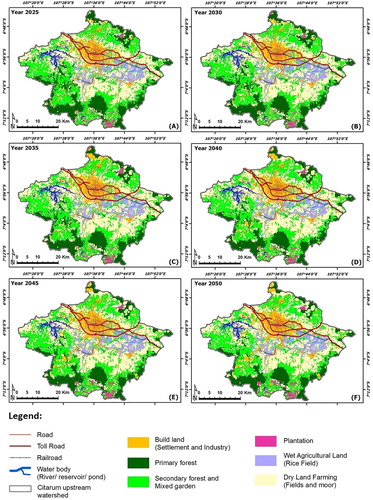
Table 5. Future land use simulated change area in 2025 to 2050 for optimistic scenarios with the percentage values for figure of merit, producer's accuracy, and user's accuracy are 72.5%, 78.5% and 79.6%, respectively.
Table 6. The estimate of average area of the future land use simulated in 2025 to 2050 for optimistic scenarios with the percentage values for figure of merit, producer's accuracy, and user's accuracy are 72.5%, 78.5% and 79.6%, respectively.
Table 7. Future land use simulated change area in 2025 to 2050 for pessimistic scenarios with the percentage values for figure of merit, producer's accuracy, and user's accuracy are 50.7%, 57.3% and 56.4%, respectively.
Table 8. The estimate of average area of the future land use simulated in 2025 to 2050 for pessimistic scenarios with the percentage values for figure of merit, producer's accuracy, and user's accuracy are 50.7%, 57.3% and 56.4%, respectively.
Data availability statement
Landsat 5 TM and SRTM30 DEM were provided by the U.S. Geological Survey (USGS). Landsat 7 ETM+, Landsat 8 OLI/TIRS, and SPOT 6 images were provided by Remote Sensing Technology and Data Center, LAPAN. Data and Analysis Center Development, Regional Development Planning Agency (Bappeda), West Java Province, Indonesia for discussion, collaboration, field surveys, and sharing spatial data to support this research.