Figures & data
Figure 1. The logistic function curve.
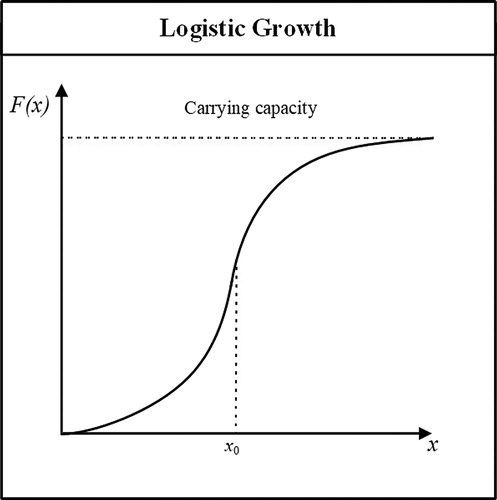
Figure 2. Schematic diagram of each variable: (a) data distribution simulation; and (b) corresponding statistics.
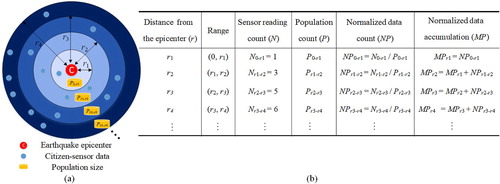
Figure 3. Spatial logistic growth of citizen-sensor data: the growth patterns of NP (the amount of normalized data) and MP (the accumulation of normalized data) are functions of the distance from the earthquake epicenter (r).
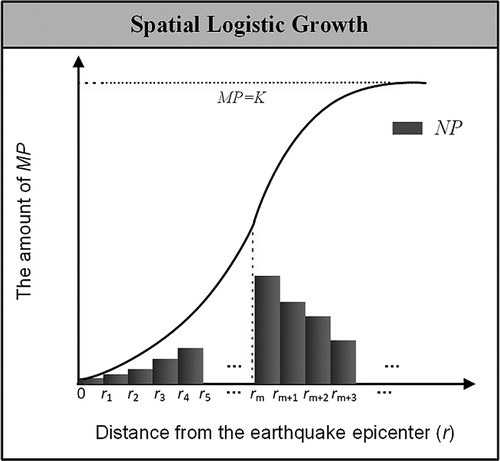
Table 1. The symbols used in the construction of the SLGM.
Figure 4. Impact area estimation workflow.
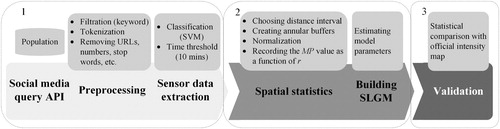
Figure 5. Overview of the study areas and data distributions.
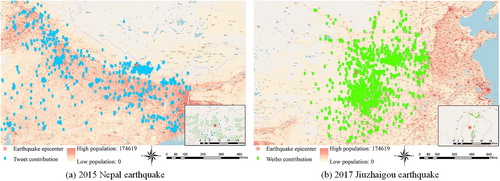
Table 2. Classification experiments performed using the free dataset as a training set. (Accuracy: a global score referring to the percentage of data correctly classified. Precision: the ratio of the number of correctly classified data over the total number of data classified as belonging to a particular class. Recall: the ratio of the number of correctly classified tweets over the total number of tweets belonging to a particular class in the test sets. F-score: the harmonic mean of precision and recall).
Table 3. Results of the classification of our tweets and Weibo messages.
Figure 6. Earthquake impact area assessment for the 2015 Nepal earthquake as derived from the SLGM analysis: (a) the model fitting result; (b) the estimated impact area.
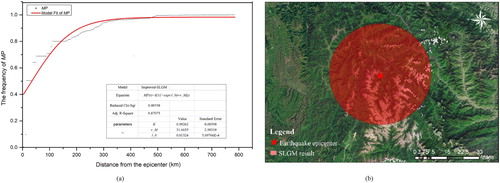
Figure 7. Earthquake impact area assessment for the 2017 Jiuzhaigou earthquake as derived from the SLGM analysis: (a) the model fitting result; (b) the estimated impact area.
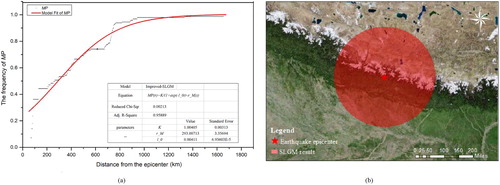
Figure 8. Comparison of the official intensity map produced by the USGS with the detection result of the impact area derived from the SLGM analysis for the 2015 Nepal earthquake.
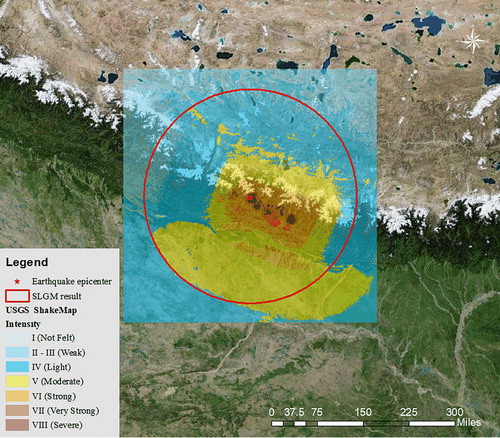
Figure 9. Comparison of the official intensity map produced by the USGS with the detection result of the impact area derived from the SLGM analysis for the Jiuzhaigou earthquake.
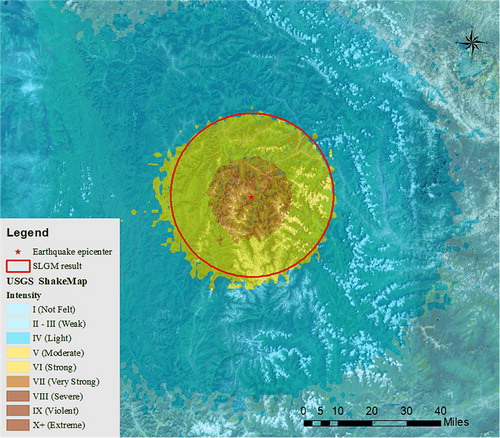
Table 4. The effect of time threshold filters on the impact area detection result produced by the SLGM.
Table 5. SLGM detection results for additional earthquake events. (Event ID: each reported earthquake event is given a unique ID by the USGS).
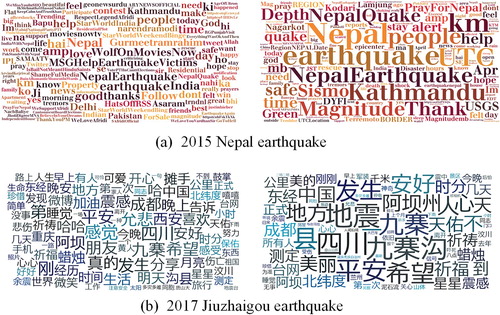
Figure 10. Word cloud of the most frequent terms during the two earthquakes.